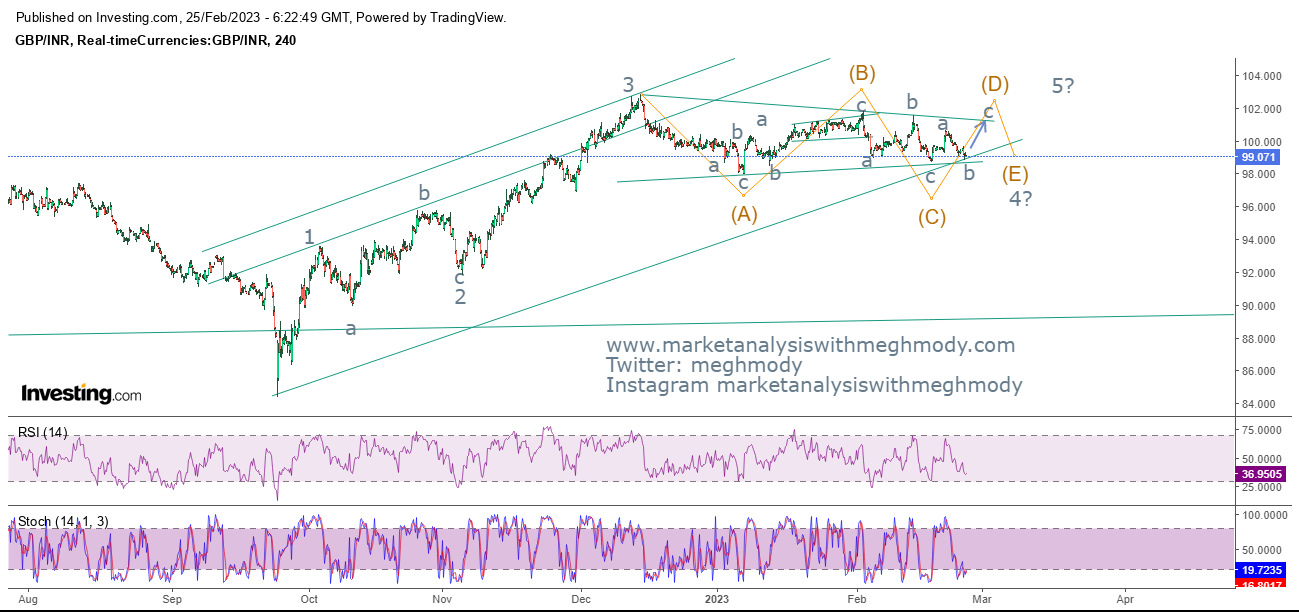
GBPINR: Symmetrical Triangle in making
GBPINR 4hour chart (spot)
Analysis
As seen in the above chart, prices are moving in a stiff range of 102-98 levels and as when time moves on the range becomes narrower thereby opening the possibility of a triangle pattern (symmetrical). For prices to give a breakout, it is important that it happens before 40% from the apex of the triangle. In the above case there is ample of time for that. Currently prices are near to the lower range of the triangle pattern and can move higher from current levels to test 101-101.50 levels over short term.
RSI and Stochastic both are near to the oversold terrain and it seems that there is a high possibility for prices to move higher from current levels.
From Waves perspective, the pair is moving in wave 4 in which it is making a symmetrical triangle pattern (a-b-c-d-e) where it is currently moving in wave d where wave c is pending on the upside. Once wave d is over wave e on the lower side will start.
The summation is GBPINR is set to move higher towards 101-101.50 price range over short term with support at 98 levels.


Comments