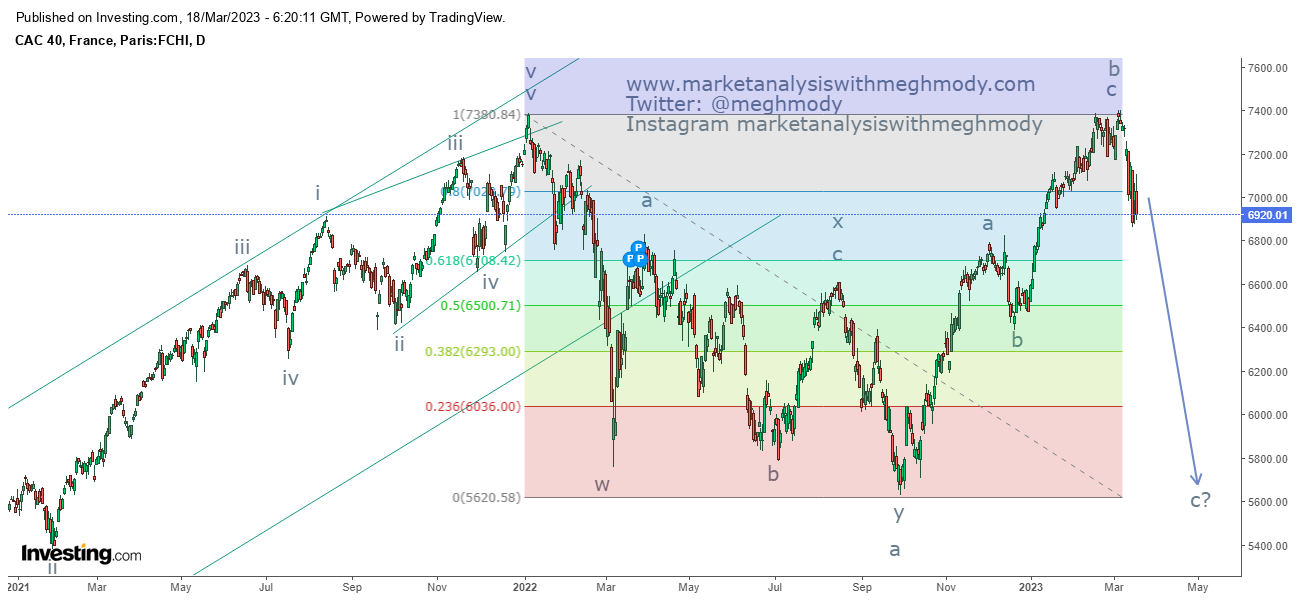
CAC40 - Wave C started
CAC40 daily chart
Analysis
As seen in the above chart, prices faced the resistance of 7400 levels and started moving down thereby breaking the 0-b trendline. This clear indicates that the trend is showing signs of reversal. Also there is a high possibility for the index to plunge going ahead and test its previous low placed at 6000 followed by 5600 levels.
From Wave perspective, the index is moving in a flat pattern (3-3-5), where it has completed wave a and wave b and has started wave c lower which can go till 6000 if incase wave c fails and can dip going ahead towards 5600 levels.
The summation is CAC40 can dip going ahead in the range of 6000 followed by 5600 levels over short to medium term.


Comments