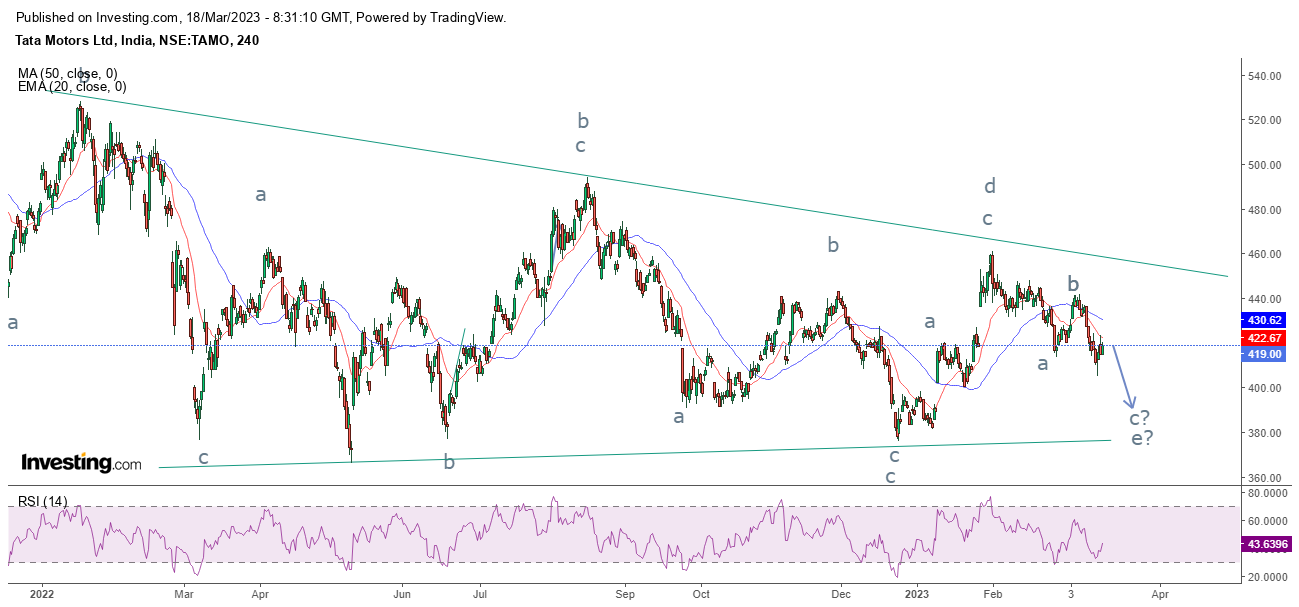
Tata Motors last leg of the triangle
Tata Motors 4 hour chart
Analysis
As seen in the above chart, prices are consolidating in a stiff range of 440-410 levels. As of now the stock has arrived near to the support of the range and can move higher from current levels. It seems that the stock might not move till 440 levels but can test 430 levels which will then make the stock plunge towards 400-390 levels.
RSI is in oversold terrain and can relieve from this zone.
Wave theory suggests, prices are moving in the last leg of the symmetrical triangle pattern where the current fall is likely to move towards 390 levels. It is also likely that prices might not test the lower trend line of the triangle which is a part of Neo Wave limiting triangle possibility as prior there are 4 touch points.
The summation is Tata Motors might go up towards 420-430 levels and then eventually will move down till 400-390 price range.


Comments