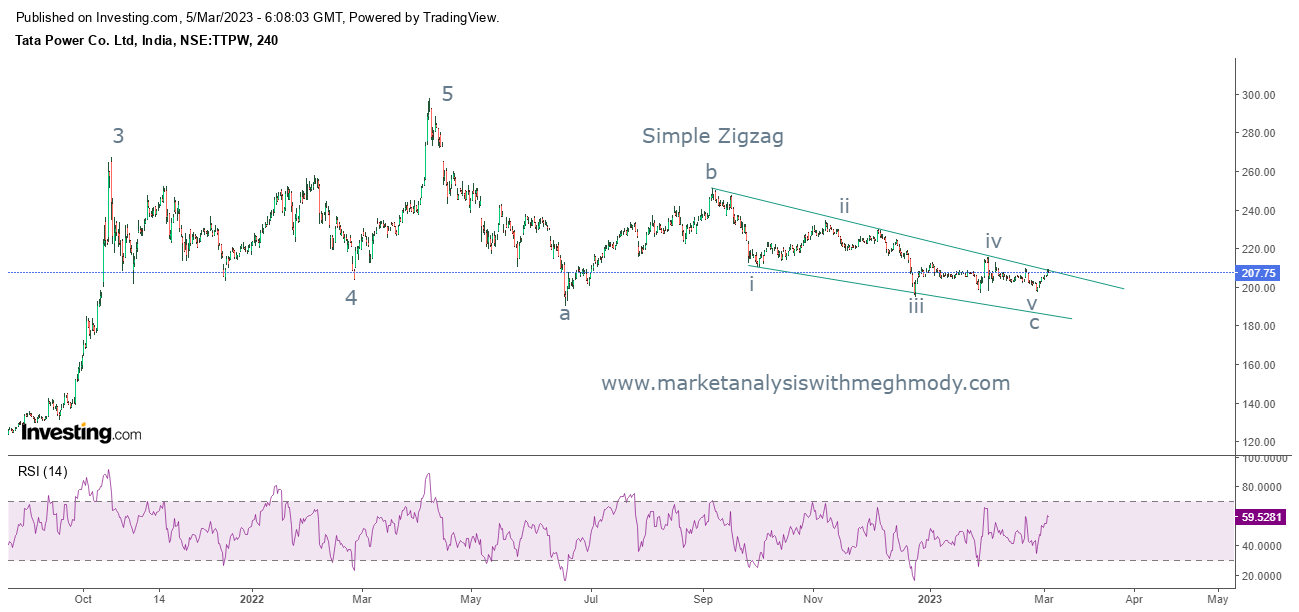
Tata Power - Simple Zigzag pattern
Tata Power 4 hour chart
Analysis
After forming a top of near to 300 levels, prices corrected and fell in a lower highs and lower lows fashion. However, it has arrived near to its previous low of 190 levels from where it has shown a sign of resilience. The stock is moving in a stiff range of 211-190 levels and it is imperative for the price to break this range for a trending move to emerge.
From Waves perspective, prices have completed simple zigzag pattern from the top, where wave b was below 61.8% of wave a and wave c was near to 61.8% from wave a to wave b. Now it is important for the stock to sustain above 211 levels which will open another leg on the higher side till the start of the ending diagonal pattern of wave c.
The summation is Tata Power needs to break above 211 levels which will open positive possibilities soaring prices towards 236-240 price range.


Comments