WTI Crude Oil
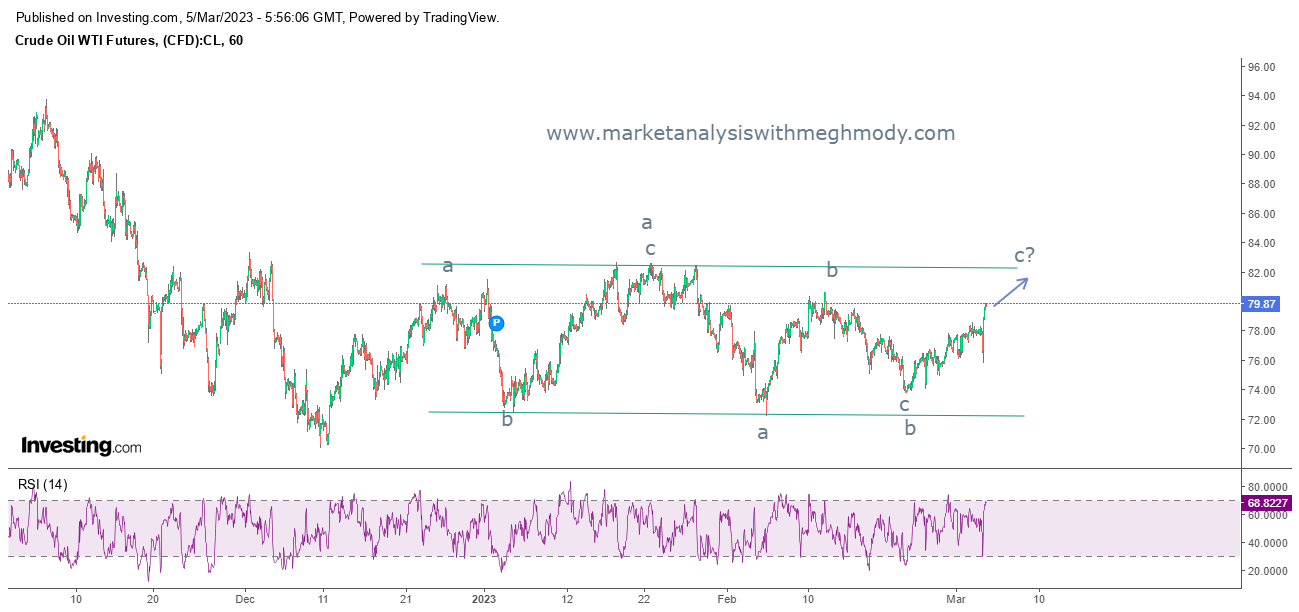
WTI Crude Oil hourly chart
Analysis
As seen in the above chart, prices are moving in a range of $72-82 levels. Recently it has bounced from the lower end of the range and it is now inching towards the higher end of the range placed at $82 levels. At present it is trading at $80 and can move up towards $82 in coming week.
From Waves perspective, prices are moving in (a-b-c) and it is likely to be a flat pattern, where wave c can go above the end of wave a. Prices are positively poised and can test $82 in couple of days.
The summation is WTI Crude can test $82 levels with support at $78.8 levels over very short term.


Comments