Bank Nifty: Elliott Wave Analysis
Bank Nifty daily chart
Bank Nifty 2 hour chart
Analysis
In my previous update I had mentioned that Bank Nifty is positively poised and can move higher. Any move above 41,350 will open further positive possibilities. However, break of 40,650 will change the trend.
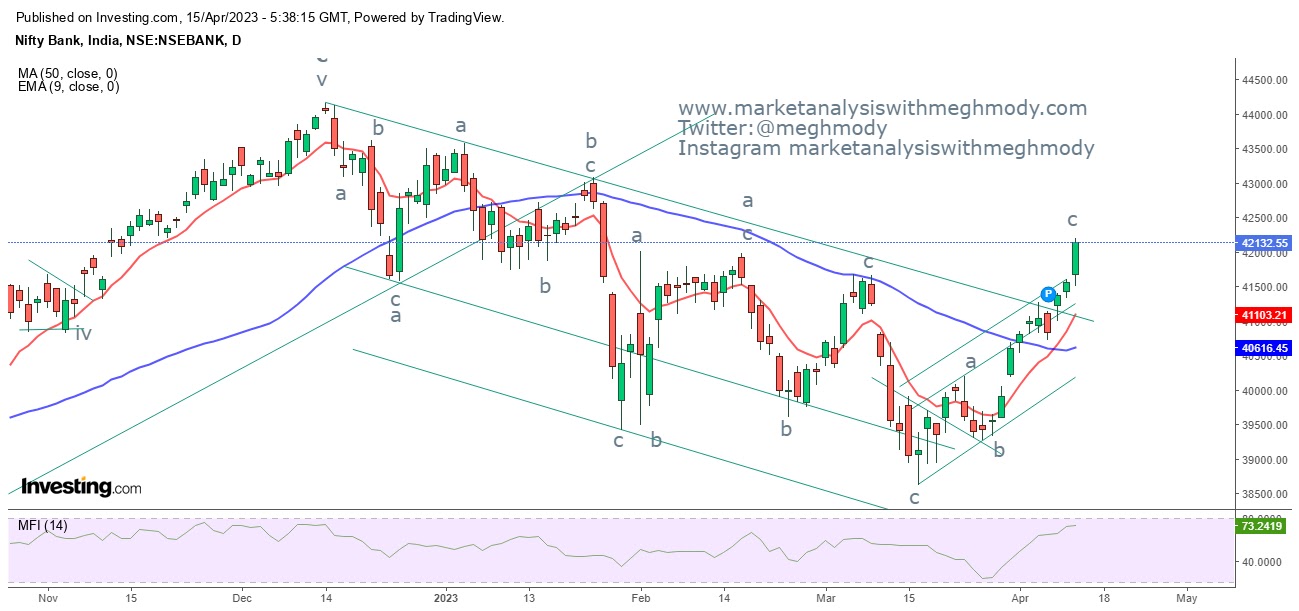
The index crossed the level of 41,350 levels which soar the price till 42,193 levels - Anticipated Happened.
To view my previous update on Bank Nifty, click on the below mentioned link.
https://www.marketanalysiswithmeghmody.com/2023/04/nifty-bank-elliott-wave-analysis_8.html
As seen in the above daily chart, prices are above both the moving averages and the short term moving average 20 EMA (red) has crossed the medium term moving average 50 SMA (blue) thereby opening bullish crossover, this has happened after January 2023 where bearish crossover happened.
From 2 hour chart, prices are moving in a higher highs and higher lows and can move higher as there is a bullish break in a falling channel pattern. There is a possibility of a gap down opening on Monday but will be short lived. The index will continue to move higher post any gap down move as the trend is firmly positive.
ROC and ADX both are showing strength. However, ADX is above 50 which is a rare phenomena.
Wave theory suggests, prices are moving in wave iii of wave c after breaking the falling channel. If is unlikely that there can be a sharp reversal from current juncture. Like I have said it will be short lived. This wave iii has the tendency to move till 42,700 which is 100% of wave i to wave ii (minimum). It can also go to its maximum possibility but I will refrain with this at present.
The summation is Bank Nifty is positively poised and any dip near about 41,700 - 42,000 can be utilized as a buying opportunity for the level of 42,700.
Join my Telegram Channel : https://t.me/elliottician1
Join My Twitter handle : https://twitter.com/meghmody?


Comments