Comex Gold and the 5th leg
Comex Gold 4 hour chart
Analysis
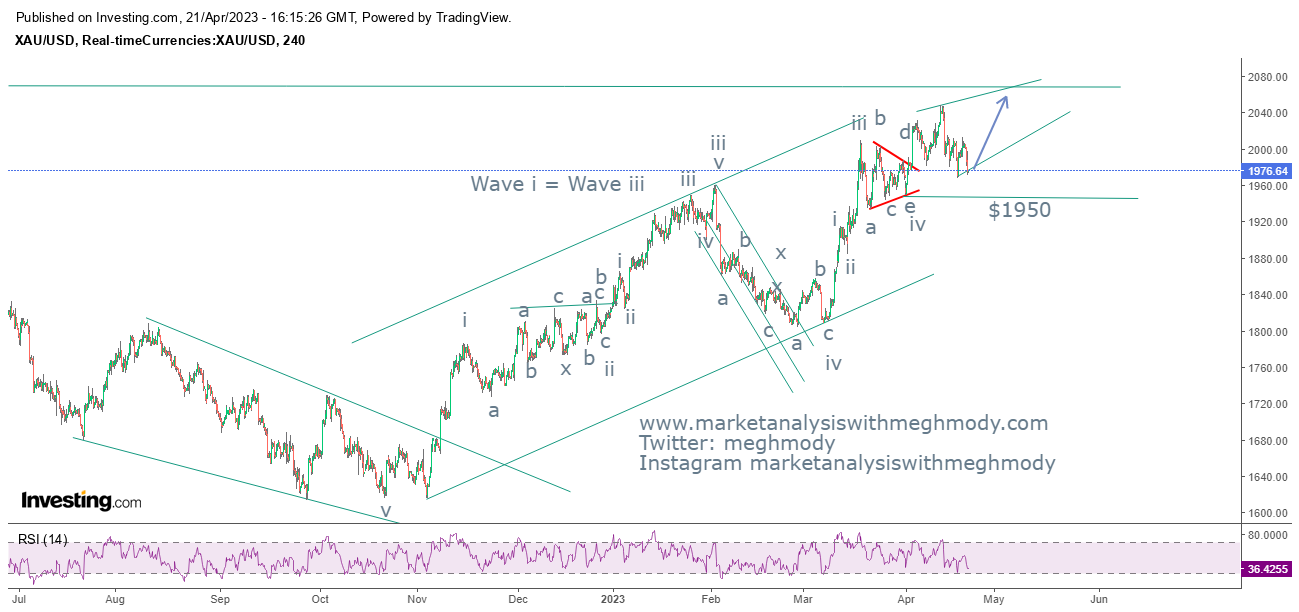
As seen in the above chart, prices continue to climb higher with the major trend being positive. The yellow metal is now closer to its potent support of $1950, if broken will change the trend from positive to negative. Failure to do so will continue the upward trend.
Prices made a high of $2048 before faltering towards $1970 this has made RSI to plunge near to its oversold terrain. There is a high possibility now that prices might start climbing back and surpass $2048 levels over short term.
From Waves perspective, the yellow metal is moving in the last leg which is wave v, seeing the characteristic of the recent up move, gold is forming an ending diagonal or expanding diagonal. I firmly think that wave ii of wave v is over and wave iii higher will start which can surge prices towards $2050-$2060 levels.
In this entire up move, wave i, wave iii and possibly wave v will be equal, if it will be equal then wave v which is forming an ending or expanding diagonal will terminate near to $2080-$2100 levels.
The summation is Comex Gold continues to be positive and can move in the range of $2050-2060 over short term. Later it can also climb near to $2080-2100 levels which will terminate the up move for once.


Comments