EURINR: A Flat Pattern
EURINR 2 hour chart
Analysis
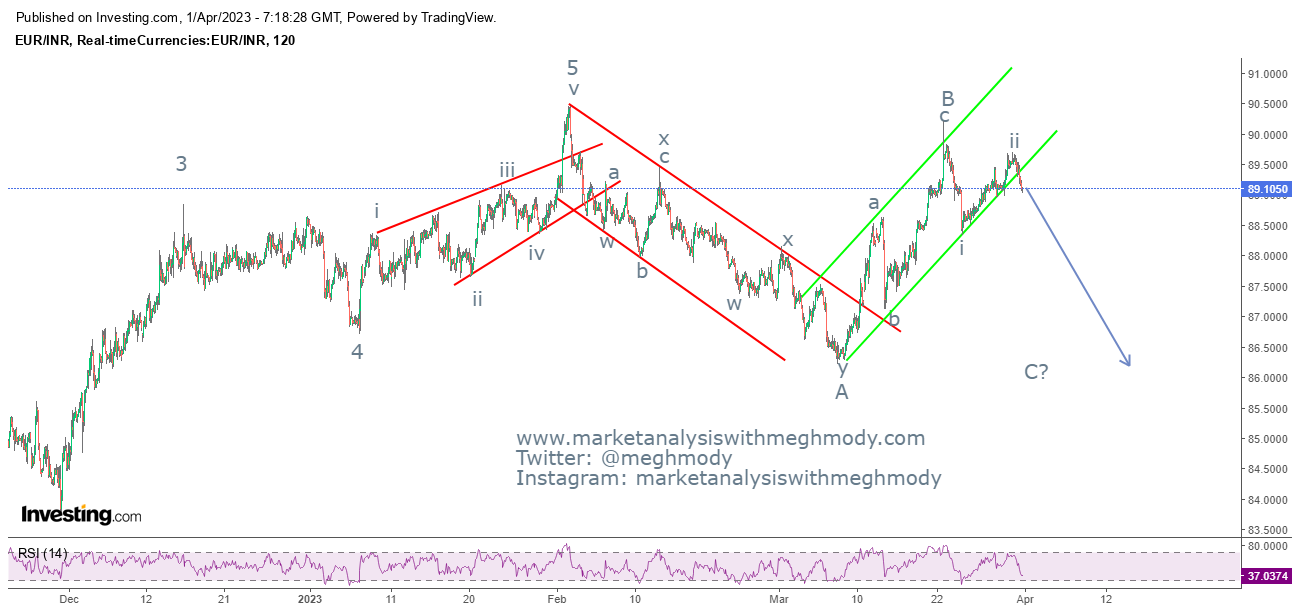
As seen in the above chart, EURINR was precisely moving in a rising green channel which was broken on Friday. There are high chances that the pair will open with a gap down on Monday and will move down thereby breaking the 89.00 levels.
From Waves perspective, prices are moving in a flat pattern (3-3-5) where in it has completed wave A and Wave B and unfolded wave C. In wave C it has completed wave i and wave ii and has started wave iii which can go till 86.70 levels which is 161.8% from wave i to wave ii. As per the pattern there are high chances for the price to retrace all of wave B in the ongoing wave which is placed at 86.00 levels.
The summation is over the short term EURINR can stumble towards 86.70 levels and over the medium term it can move till or below 86.00 levels.


Comments