FTSE 100 : Elliott Wave Analysis
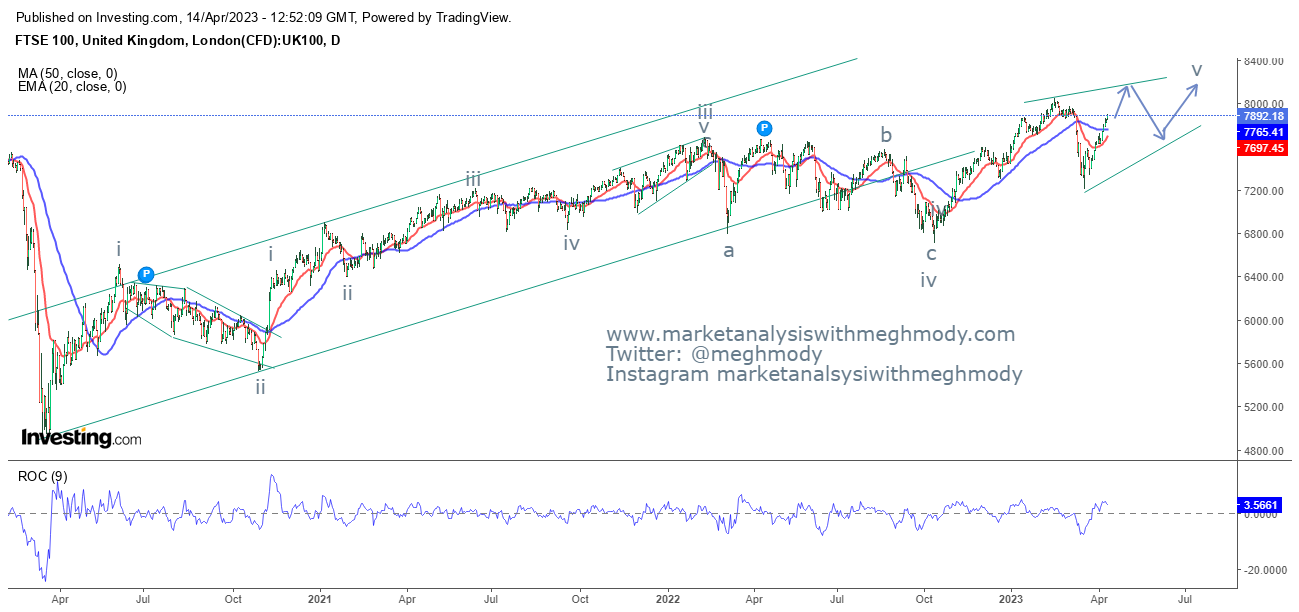
FTSE100 daily chart
Analysis
As seen in the above chart, prices are moving in a higher highs and higher lows. Recently prices were correcting and made a low of 7,309 levels and could not break its previous low of 6,707 levels which makes the positive formation intact. At present, the index is moving higher and there is a high possibility that it will cross its previous high of 8,058 levels.
From Waves perspective, the index is moving in wave v and it is very clear that it will form an ending or expanding diagonal. I will stick to the former pattern and currently it is going higher in wave iii of wave v and will cross 8,058 levels.
The summation is FTSE100 is likely to move higher towards 8,050-8,100 levels over short term.
Join my Telegram Channel : https://t.me/elliottician1
Join My Twitter handle : https://twitter.com/meghmody?


Comments