Nifty Elliott Wave Counts
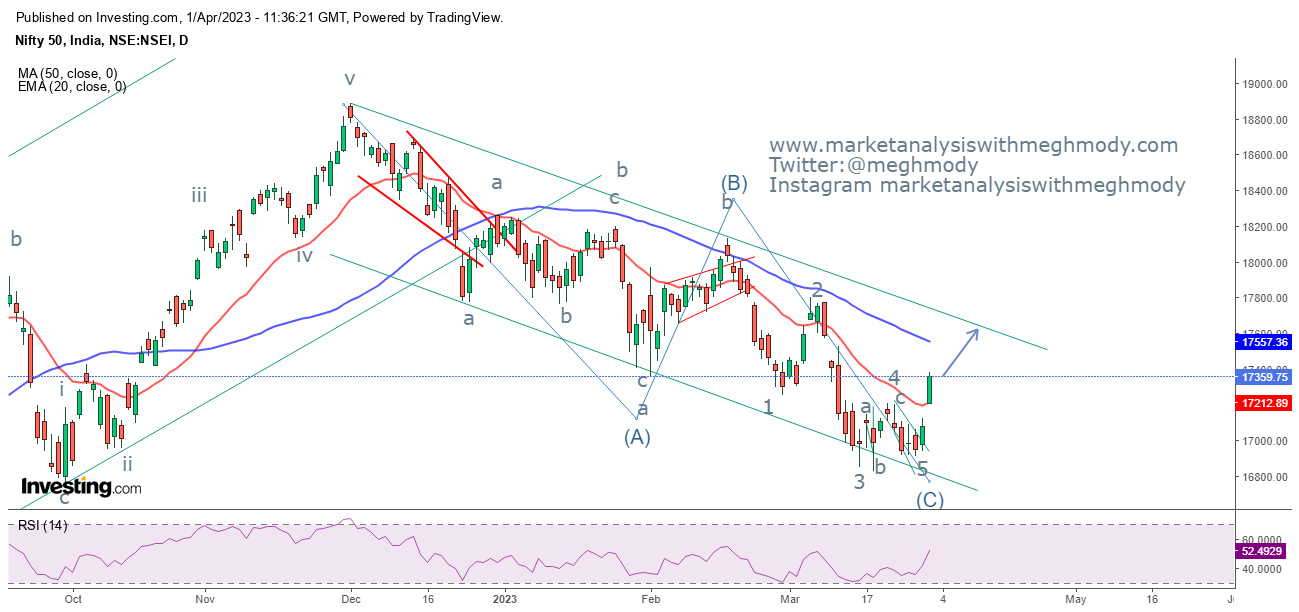
Nifty daily chart
Nifty 2 hour chart
Analysis
In my previous update I had mentioned that once the level of 17305 is taken out, a bottom is in place and prices will rise back.
Last week the index moved above 17305 and closed strong on Friday which will now make the index move in the range of 17400-17600 levels as mentioned in my previous update.
To read my previous update on Nifty, click on the below mentioned link
https://www.marketanalysiswithmeghmody.com/2023/03/nifty-anticipated-happened.html
As seen on the above daily chart, the index is moving in a falling channel has has picked up momentum from the lower end of the channel. A gap up opening was seen last week which was un-filled making it as a breakaway gap and thereby opening a directional move in the index. The index has also crossed its previous high which is the first time happening in past 4 months, thereby opening positive possibilities. RSI has also started moving higher and crossed the center line.
In the weekly chart, the index has formed a morning star at the bottom. In the monthly chart it has formed a doji after three months of successive downfall.
From 2 hour chart, prices have started showcasing bullish momentum post consolidation at the bottom. The index is moving higher post gap up with no signs of reversal. Along with the two short term moving averages has also given a bullish crossover which is a positive sign indicating that there can be a potential reversal or a pullback happening in the index.
Wave theory suggest, the index has completed five waves down in the form of wave C where wave 5 was a failure and in expanding diagonal pattern. The current up move looks impulse and can be wave x or a fresh leg on the upside which is only possible once it crosses 17600 on the higher side.
The summation is Nifty is positively poised and can move higher towards the level of 17550-17600 levels over short term.
Join my Telegram Channel : https://t.me/elliottician1


Comments