WTI Crude Oil - Elliott Wave Analysis
WTI Crude Oil 4 hour chart
WTI Crude Oil 1 hour chart
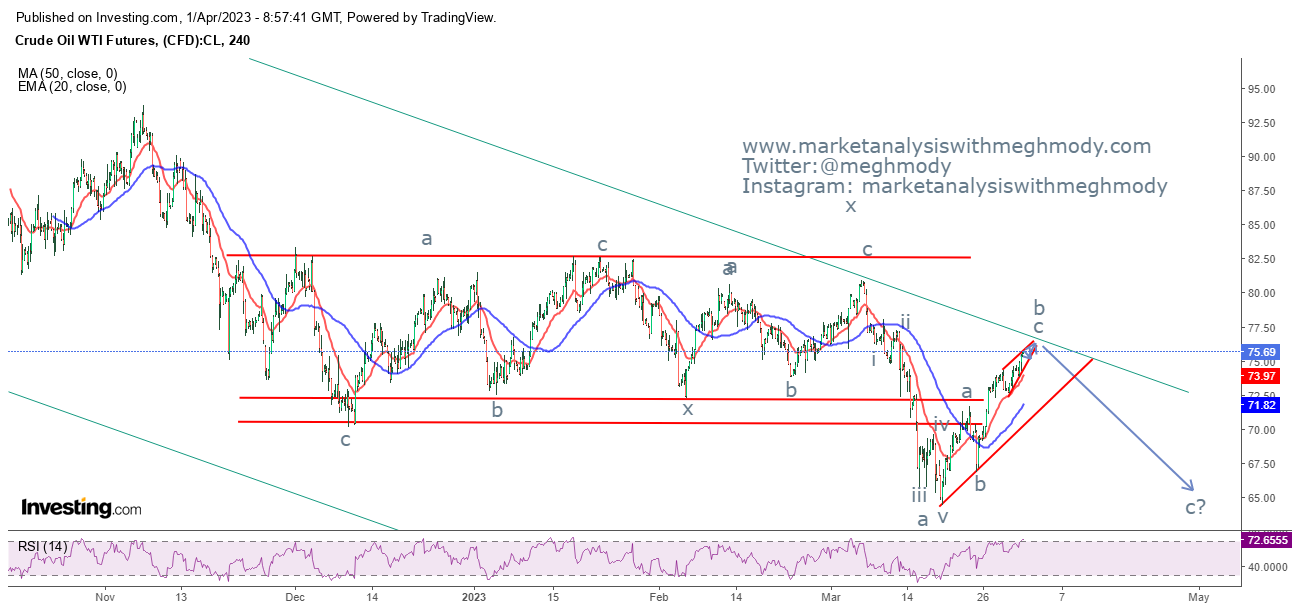
From the above chart, prices are moving in a lower highs and lower lows fashion. At present, prices are arriving near to the resistance of the falling channel and there it is forming a rising wedge pattern. This pattern gives a bearish breakout which will open negative possibilities from the resistance. RSI is also near to the overbought terrain and it is exhibiting negative divergence.
As per Wave theory, from hourly chart, Crude oil prices are moving in wave b after wave a was over at $64.42. From there it is moving up in a corrective structure. Currently it is moving in the last leg of the pattern which is ending diagonal. In this pattern wave iv and wave v is pending which might take couple of days and once this is completed, there are high chances for the price to reverse which will start wave c lower towards $66-$64 levels.
The summation is WTI Crude Oil price is likely to sink towards $66-$64 levels, for this target to achieve, prices should not cross the level of $77.50.
Join my Telegram Channel : https://t.me/elliottician1


Comments