Comex Gold Anticipated Happened and Elliott Wave Analysis
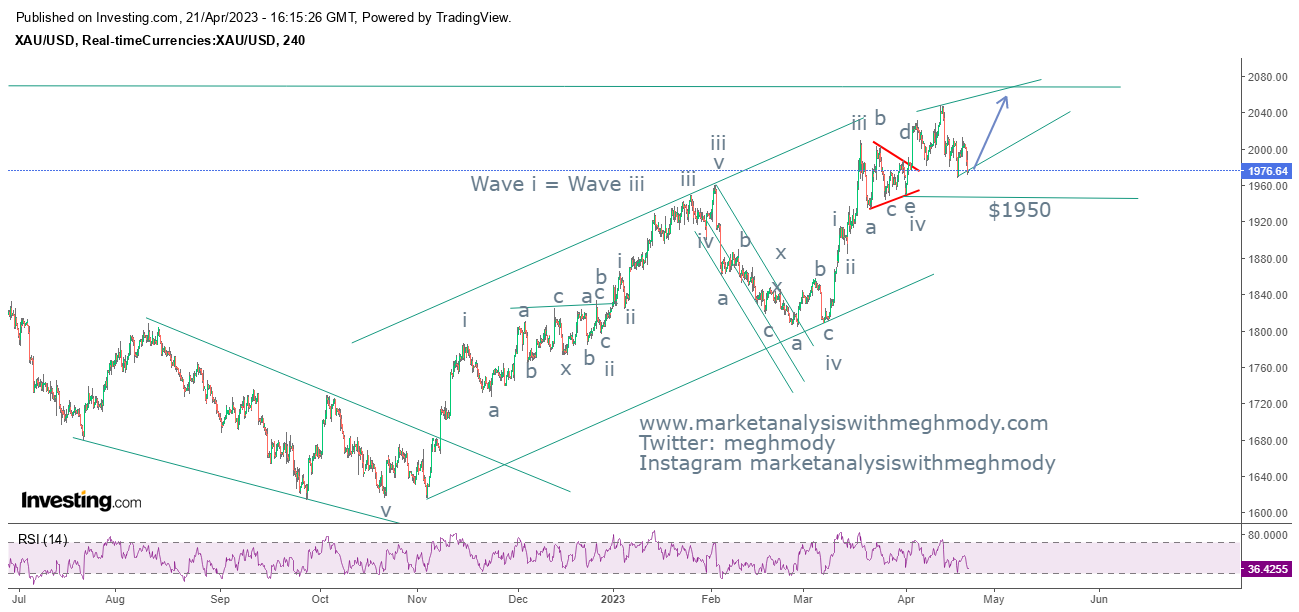
Comex Gold 4 hour chart anticipated on 21st April 2023
Comex Gold 4 hour chart happened on 3rd May 2023
Analysis
In my previous update dated 21st April I had mentioned that, "Comex Gold continues to be positive and can move in the range of $2050-2060 over short term. Later it can also climb near to $2080-2100 levels which will terminate the up move for once."
Prices continue to move in the uptrend and achieved my level of $2050-2060 and also moved till $2100 by protecting the level of $1950 levels - Anticipated Happened
To view my previous article on Comex Gold, click on the below mentioned link
From the above chart, prices are moving in a expanding wedge pattern and has moved towards $2100 levels which was short lived and has come down from there. There is a high possibility for the yellow metal to move down below $2000 levels and test $1970-$1980 levels where there is a support of the lower trend line of the pattern and again there can be a final attempt for the price to cross its previous swing high.
As per Wave theory, prices are moving in an expanding diagonal where wave iii is completed and it has started wave iv on the lower side which can move down and terminate near $1980 levels, a final attempt on the higher side can be close to $2100-$2110 levels.
The summation is Comex Gold can test $1970-$1980 levels and from there it can move up till $2100-$2110 levels. The bias remains positive for the yellow metal as far as $1950 is protected on the downside.
Join my Telegram Channel : https://t.me/elliottician1
Join My Twitter handle : https://twitter.com/meghmody?


Comments