Finnifty wave ii still in motion?
Finnifty daily chart
Finnifty 2 hour chart
Analysis
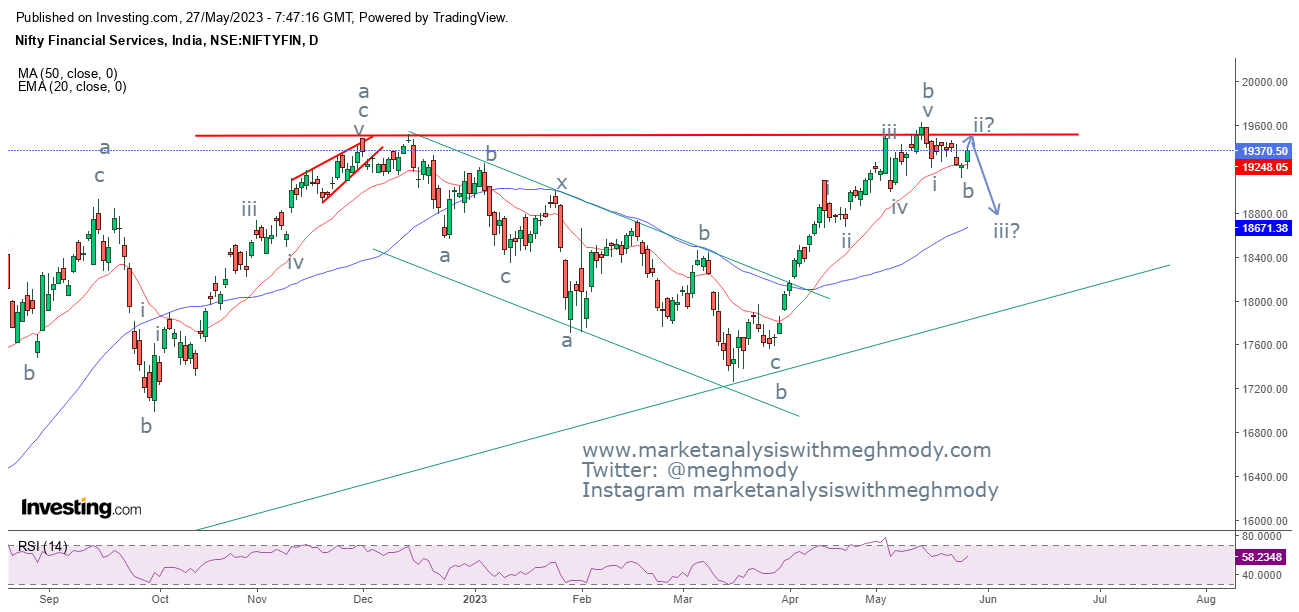
From the above daily chart, prices are moving in big range of 19600 on the higher side and on the lower side 17200. As prices are near to the resistance of the range there are high chances that the index can reverse and prices can start moving down over medium term. Over short term there are high chances that the index will consolidate near to the resistance for some time.
As seen in the 2 hour chart, the index is moving in a range of 19000 -19600 price range and can move higher from current levels to test the upper extreme. Also the index option analysis suggests that highest OI is built up at 19500 levels and on the downside 19300-19200 levels. So prices can move higher from here to test 19500-19600 levels and then falter for the next expiry and week.
As per Wave theory, the index is moving in wave ii. After completing wave i at 19210, prices moved up where the subdivisions of the wave was expanded and currently prices are moving up in wave c which is the last leg of wave ii where it can go higher till 19500-19600 levels and complete wave ii. Thereby it will open wave iii where it can falter towards 100% to 161.8% which comes to 19000 or 18750 levels.
The summation is Finnifty is negatively poised but can first make an attempt to test 19500-19600 levels and then reverse the trend from there and test 19000 followed by 18750 levels.
Join my Telegram Channel : https://t.me/elliottician1
Join My Twitter handle : https://twitter.com/meghmody?


Comments