Nifty Bank Elliott Wave Analysis
Nifty Bank daily chart
Nifty Bank 2 hour chart
Analysis
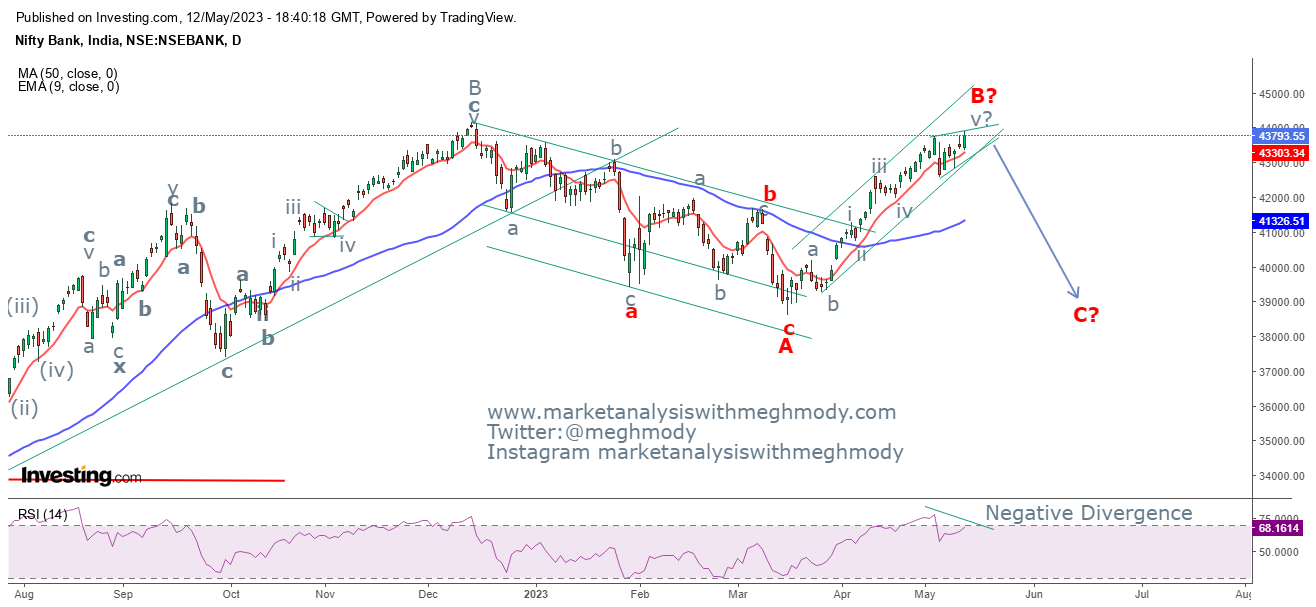
From the above daily chart, Nifty Bank continues to move higher and has also crossed its previous high which opens positive possibilities. However, RSI has arrived in the overbought terrain and can make the index move in a limited range going ahead. The oscillator is also exhibiting negative divergence which is a sign of caution.
The index continues to trade well above both the moving averages which gives an indication that it is very difficult for the index to show any reversal yet, but there can be profit booking which can drag prices near to its previous swing low.
As seen in the 2 hour chart, the benchmark has arrived near to its previous high and has started showing negative divergence which is not a healthy sign. Along with that, it is likely that it might remain in the range of 4400-43500 levels in coming week as there is a good open interest built up near 43500 which will now act as a support for the index.
As per Wave theory, I think prices are moving in wave v in which there is a high possibility of an ending diagonal pattern. Where it has completed (i-ii-iii) and will open wave iv lower which can test or come near to 43500 levels followed by 43000 levels thereby terminating wave iv of wave v and then wave v can go higher.
The summation is Nifty Bank can move down from current levels to test 43500 levels followed by 43000 levels with resistance placed at 44000 (weekly closing basis).
Join my Telegram Channel : https://t.me/elliottician1
Join My Twitter handle : https://twitter.com/meghmody?


Comments