USDINR: Will it cross 83.00?
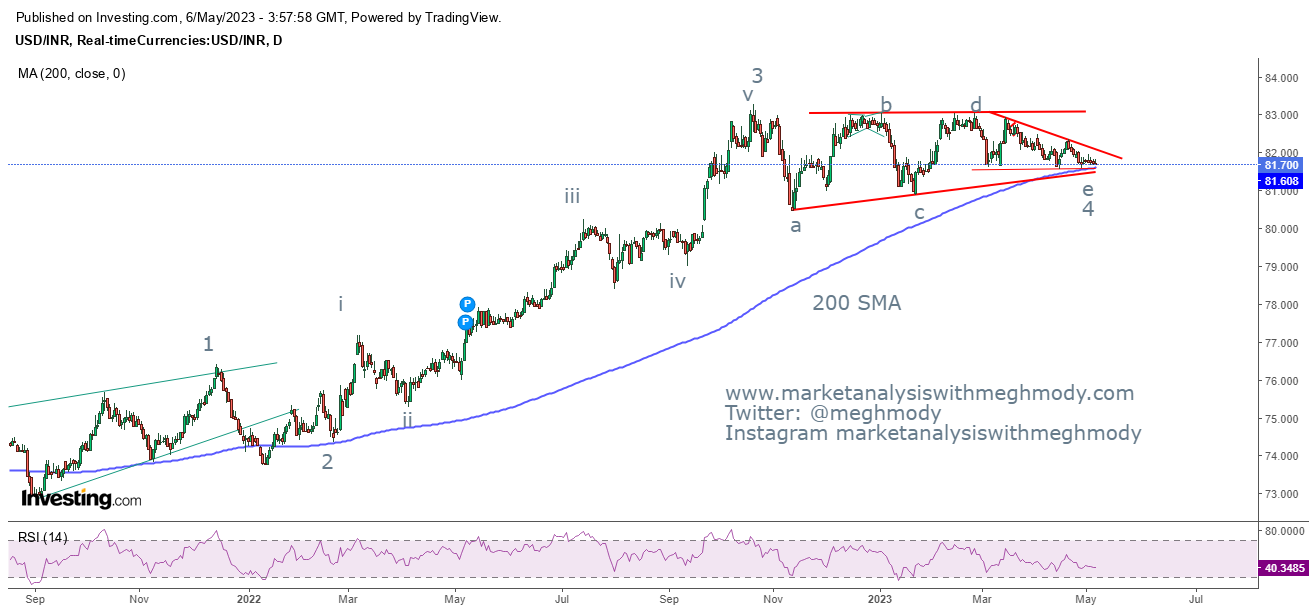
USDINR daily chart anticipated on May 6th 2023
USDINR daily chart happened on May 19th 2023
Analysis
In my previous update I had mentioned for USDINR, "USDINR is expected to open positive possibilities once the level of 82.15 is taken out on the upside which can propel price towards 83.00 over short term and then any move above 83.00 will surge it towards 84.50-85.00 levels. However, any break below 81.40-81.00 levels will negate the upside view."
There were cluster of supports near 81.40-81.00 levels and from there the pair has reversed thereby breaking 82.15 levels and made a high close to 83.00 levels - Anticipated Happened
To view my previous article on USDINR, click on the below mentioned link
https://www.marketanalysiswithmeghmody.com/2023/05/usdinr-at-multiple-supports-and-elliott.html
As seen in the above daily chart, the pair has arrived near cluster of resistances which is also the consolidation zone formed from past 6-7 months. If prices move above this level which is 83.00 (upper red horizontal line) there are high chances that the pair will accelerate towards new all time high and remain in the unchartered territory for some time.
Daily ADX in the lower panel is well above 20.00 levels which has happened after two months suggesting that the trend which in this case is up, is picking up strength.
From Waves perspective, prices are moving in a ascending triangle pattern. The triangle pattern forms in wave 4 and from 81.50-81.60 levels where wave 4 has ended, wave 5 has started and there is a high possibility for the price to break the multiple resistances of 83.00 which can soar the pair towards 85.00-86.00 levels where 38.2% of wave 0 to wave 3 added to wave 4.
The summation is USDINR is likely to cross 83.00 levels this time which will add buying pressure surging the pair in the price range of 85.00-86.00 levels over short to medium term.
Join my Telegram Channel : https://t.me/elliottician1
Join My Twitter handle : https://twitter.com/meghmody?


Comments