WTI Crude Oil and Elliott Wave Counts
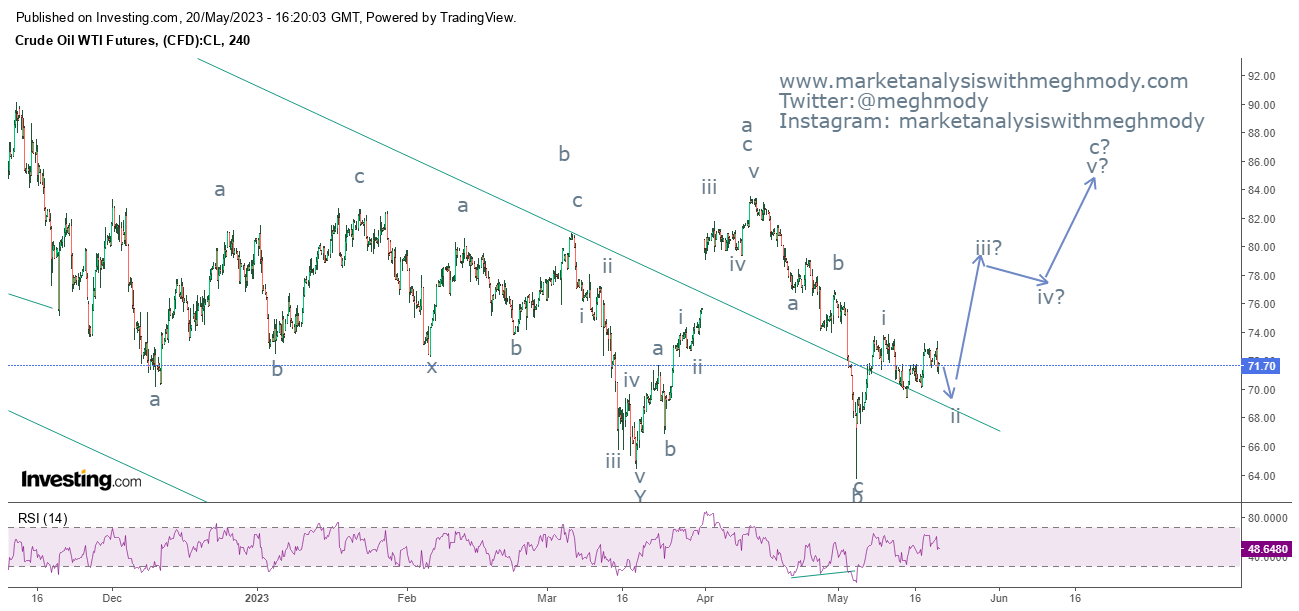
WTI Crude Oil 4 hour chart
Analysis
As seen in the above chart, prices are moving in a sideways direction particularly in the range of $74- $69. It is imperative for prices to break this range for a trending or directional move to emerge. As far as prices persists in the above mentioned range the bias will be sideways.
Also to add here that prices have reversed from the resistance of the range and it is moving down which can drag prices to test the support of the lower extreme of the range.
From Waves perspective, prices are moving in wave ii after completing wave 1 at $74 levels. In wave ii prices are moving in a flat pattern (a-b-c) where wave a and wave b is over and wave c on the downside will open which can falter prices near to $69.50-$69.00 levels.
The summation is WTI Crude Oil prices are expected to drop till $69.50-$69.00 price range before resumption of the major trend.
Join my Telegram Channel : https://t.me/elliottician1
Join My Twitter handle : https://twitter.com/meghmody?


Comments