DLF - Five waves completed
DLF daily chart
Analysis
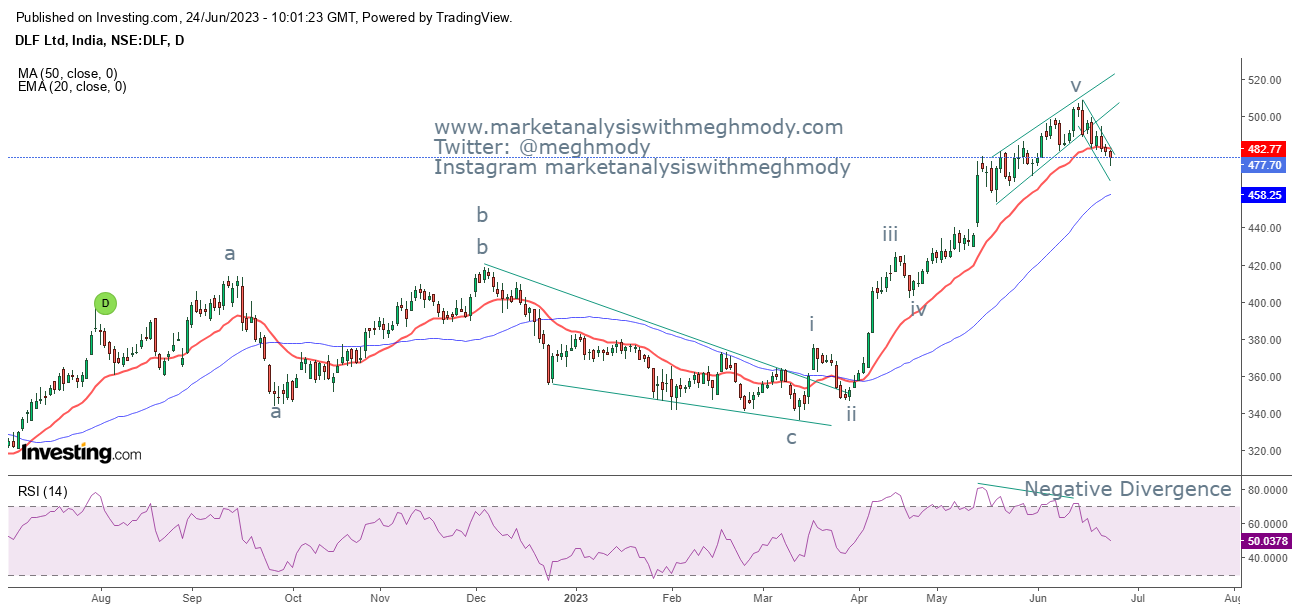
As seen in the above chart, prices which were moving in a higher highs and higher lows and have discontinued the positive formation, thereby opening negative possibilities. The stock has gone up till 508 levels but could not sustain higher and broke its previous swing low of 480 levels. It has also closed below the 20 EMA (red) moving average which has happened after March 2023. RSI has also exhibited negative divergence and has slumped towards the center line.
From Waves perspective, prices are moving in a five wave structure which has completed where wave v was formed in ending diagonal pattern. After that the pattern was broken and started moving in a falling channel. Prices are moving in a corrective structure mainly wave a which can find support near to 465-460 levels.
The summation is DLF is expected to falter towards 465-460 price range over short term.
Join my Telegram Channel : https://t.me/elliottician1
Join My Twitter handle : https://twitter.com/meghmody?


Comments