SBI Wave 2
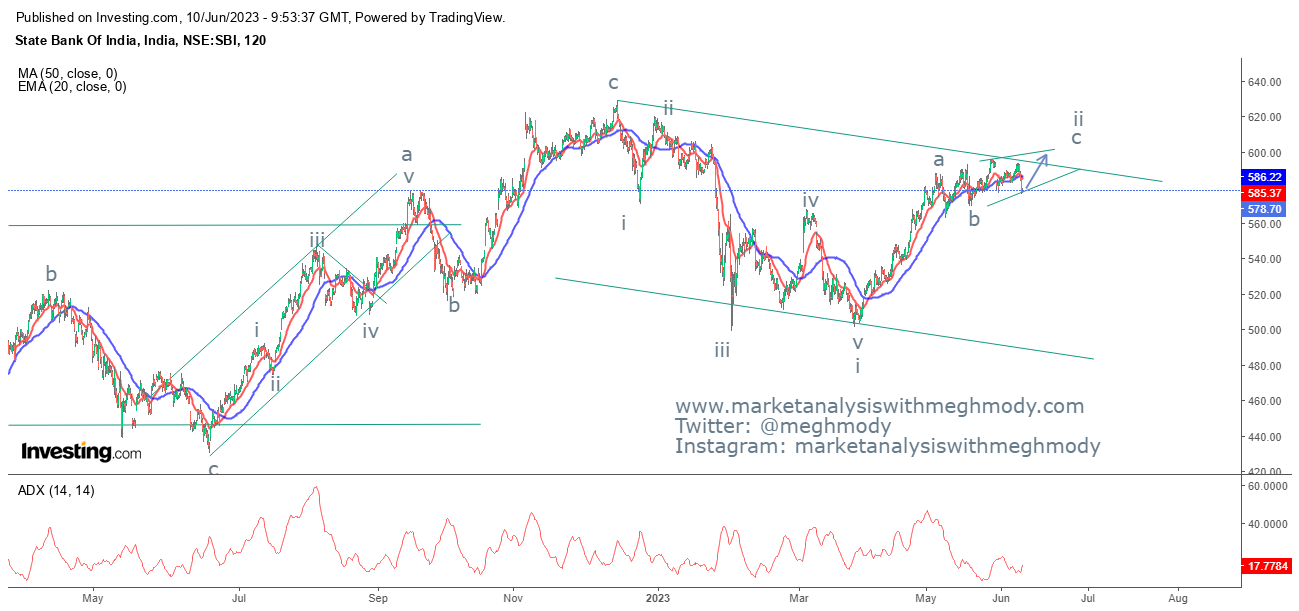
SBI 2 hour chart
Analysis
As seen in the above chart, the banking stock is moving in a positive direction with minor dips in a row. The stock as of now is positively poised and can move higher from current levels going ahead. However, the momentum in the stock is fading as compared to what it was from the lows. I am of the opinion that it can eventually form an rising wedge pattern.
From Waves perspective, the stock is moving in a corrective pattern where it completed wave a and wave b and now it is moving in wave c where wave i and wave ii is over and wave iii will resume which can take prices near to its previous swing high.
The summation is SBI can make an attempt towards 596-600 levels over short term.
Join my Telegram Channel : https://t.me/elliottician1
Join My Twitter handle : https://twitter.com/meghmody?


Comments