Posts

Showing posts from July, 2023

FinNifty

Image
 FinNifty daily chart Analysis The index is moving in a higher highs and higher lows but RSI is exhibiting negative divergence which is a sign of caution. However, it is  not clear that the index has started moving down in another leg. So it is important to see if previous supports are taken out of not going ahead which will discontinue the positive formation. As per Wave theory, the index has completed wave 5 of wave c of wave B or a part of it as the correction after wave 5 is corrective in nature and has retraced 50% of it. So there can be an attempt for the index to move higher towards its previous high. The summation is, as far as 19450 is intact on the downside there can be an attempt made by the index to move towards 20600 levels. Join my Telegram Channel :  https://t.me/elliottician1 Join My Twitter handle :  https://twitter.com/meghmody? s=11&t=LtKvFYlMyQs71k-udwEPgQ

Bank Nifty

Image
 Bank Nifty daily chart Analysis Bank Nifty which has moved higher in five waves faced resistance at 38.2% from 0-3 added to 4, formed a doji in the daily chart and from there prices are moving down, the current fall looks to be corrective and it is imperative that prices break 44500 for more clarity of correction. If not, then the index will continue to climb higher. The index has completed five waves up in the form of wave c of wave B and can start the down move in wave C. However, the down move is corrective in nature which indicates wave C on the lower side has not started. The summation is Nifty bank needs to break 44500 which is the support of the rising channel, break of this will infuse selling pressure which can drag price towards 44100 levels. Join my Telegram Channel :  https://t.me/elliottician1 Join My Twitter handle :  https://twitter.com/meghmody? s=11&t=LtKvFYlMyQs71k-udwEPgQ

Nifty

Image
 Nifty weekly chart Analysis Nifty has crossed its previous week high thereby negative the importance of shooting star which was formed two weeks prior. However, it still hovers near to 127.6% of the Fibonacci resistance which is still very much active. It is imperative for the index to cross this zone of  9500-19700 decisively to open further positive possibilities which can take the index towards 21000. From Waves perspective, the index is still moving in wave v of wave c of wave B and as of now there is no reversal. The summation is if Nifty crosses the zone of 19500-19700 decisively then this will be impulsive and not corrective which can take the index till 21000. Join my Telegram Channel :  https://t.me/elliottician1 Join My Twitter handle :  https://twitter.com/meghmody? s=11&t=LtKvFYlMyQs71k-udwEPgQ

Taiwan Weighted Index and Elliott Wave forecasting

Image
 Taiwan Weighted Index daily chart Analysis In my previous update I had mentioned for TWI, " Taiwan Weighted is near crucial resistance, any sustainable move above 17,100 will continue the uptrend and the benchmark can reach till 18,000 levels. However, reversal from current levels will drag prices till 16,300-16,100 levels." The index crossed 17100 and from there it slumped towards 16400 levels but again it closed above 17100 levels thereby opening positive possibilities for the index to reach now towards 18000 and beyond. To read my previous article on TWI, click on the below mentioned link https://www.marketanalysiswithmeghmody.com/2023/06/taiwan-weighted-anticipated-happened.html As seen in the above chart, prices are in the last leg of the 3rd wave which is wave v and can go till 17600-17700 levels from there, there can be wave 4 which will mainly remain sideways as wave 2 was steeper (alteration) and then eventually wave 5 will start which can go above 18000 levels. The...

Silver Comex

Image
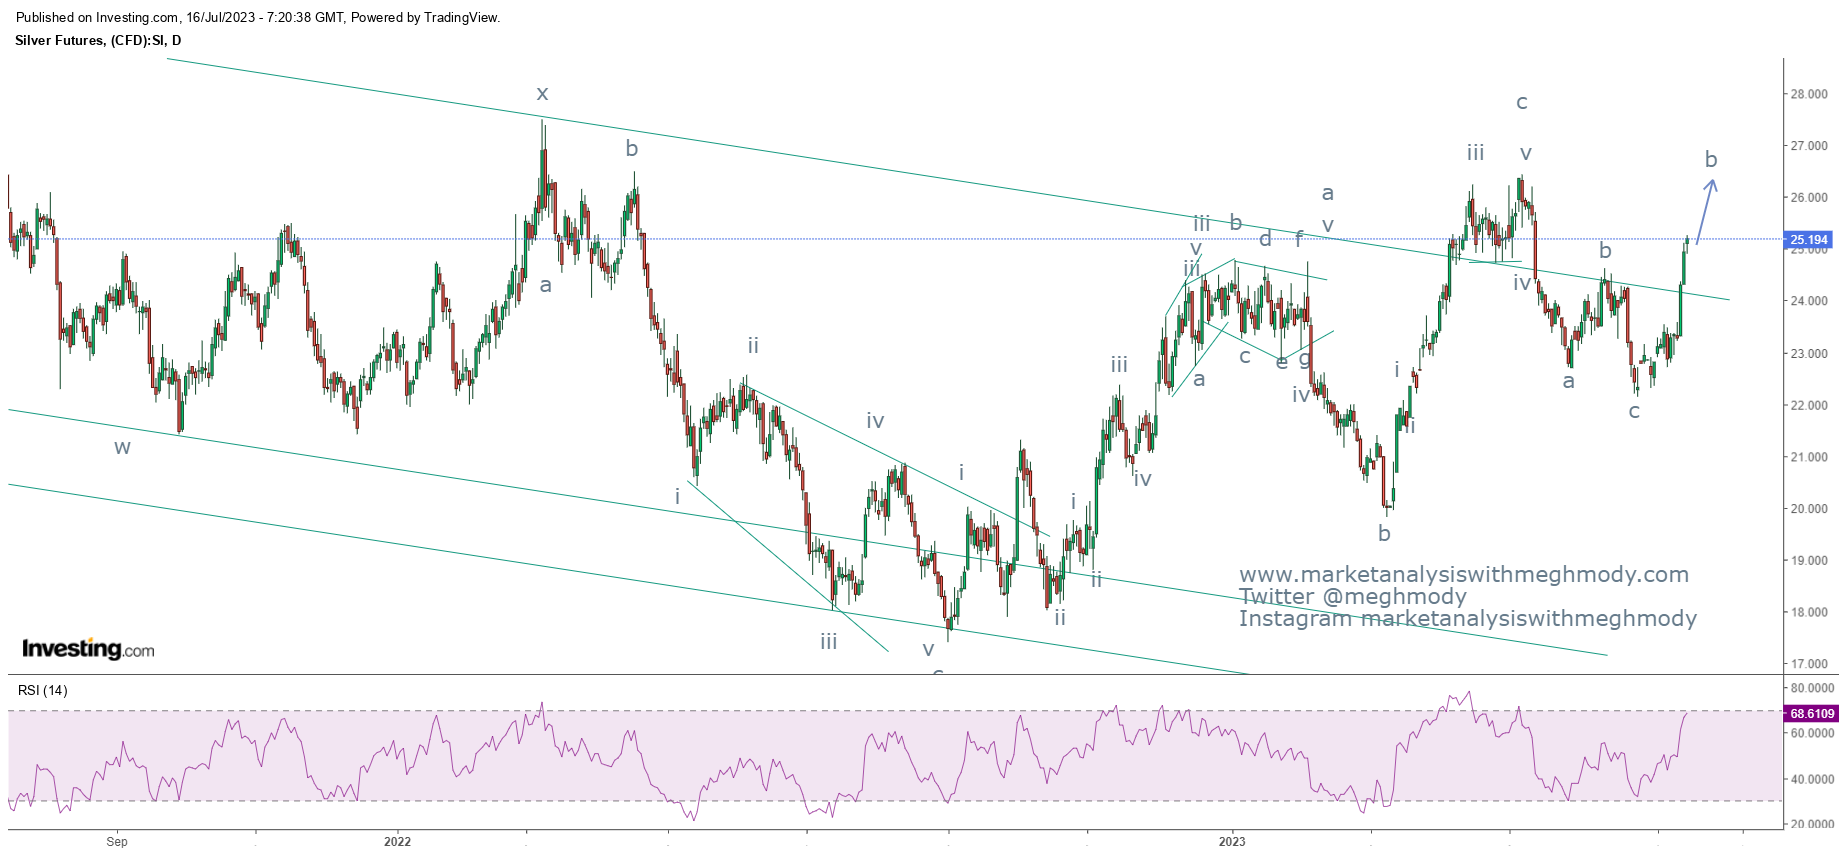
 Silver Comex daily chart Analysis Prices are moving above the falling channel and can move higher near to its previous high placed at $26.00 levels going ahead. However RSI is in overbought terrain and can relieve from here. As per wave theory, prices are moving in corrective wave or can also be an impulse if it continues to move higher well above $26.00 levels.  The summation is Silver Comex prices can surge till $26.00 levels going ahead and can even move higher once its resistance is taken out decisively. Join my Telegram Channel :  https://t.me/elliottician1 Join My Twitter handle :  https://twitter.com/meghmody? s=11&t=LtKvFYlMyQs71k-udwEPgQ
BITCOIN and Elliott Wave Forecasting

Image
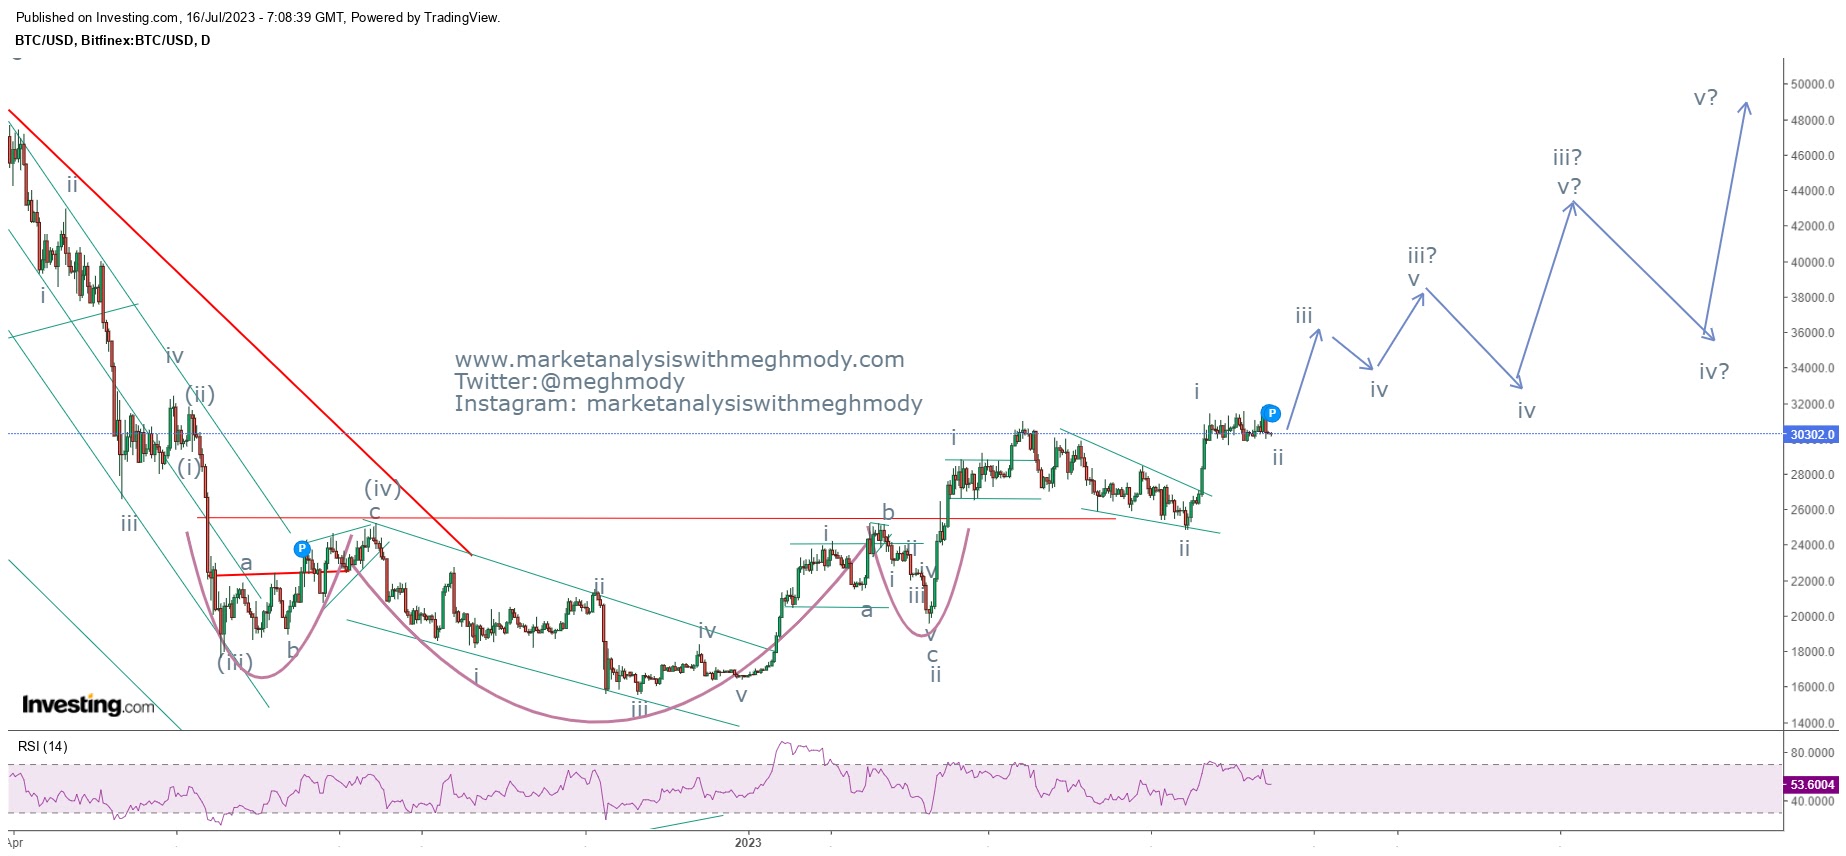
 BTC daily chart Analysis From the above chart, prices are moving in a higher highs and higher lows and it is in a stealth uptrend thereby opening positive possibilities going ahead. As per Wave theory, prices are moving in an impulse fashion where wave iii of wave iii is extended also known as extension within extension. This entire up move has the tendency to reach towards $48000-$50000 minimum. As of now prices can consolidate in the range of $31600-$29800 levels, one the above extreme breaks it is likely that the crypto can soar till $35000-$38000 price zone. The summation is Bitcoin is likely to move till $35000-$38000 zone once the level of $31600 is taken out decisively. Join my Telegram Channel :  https://t.me/elliottician1 Join My Twitter handle :  https://twitter.com/meghmody? s=11&t=LtKvFYlMyQs71k-udwEPgQ
EURINR: Impulse wave

Image
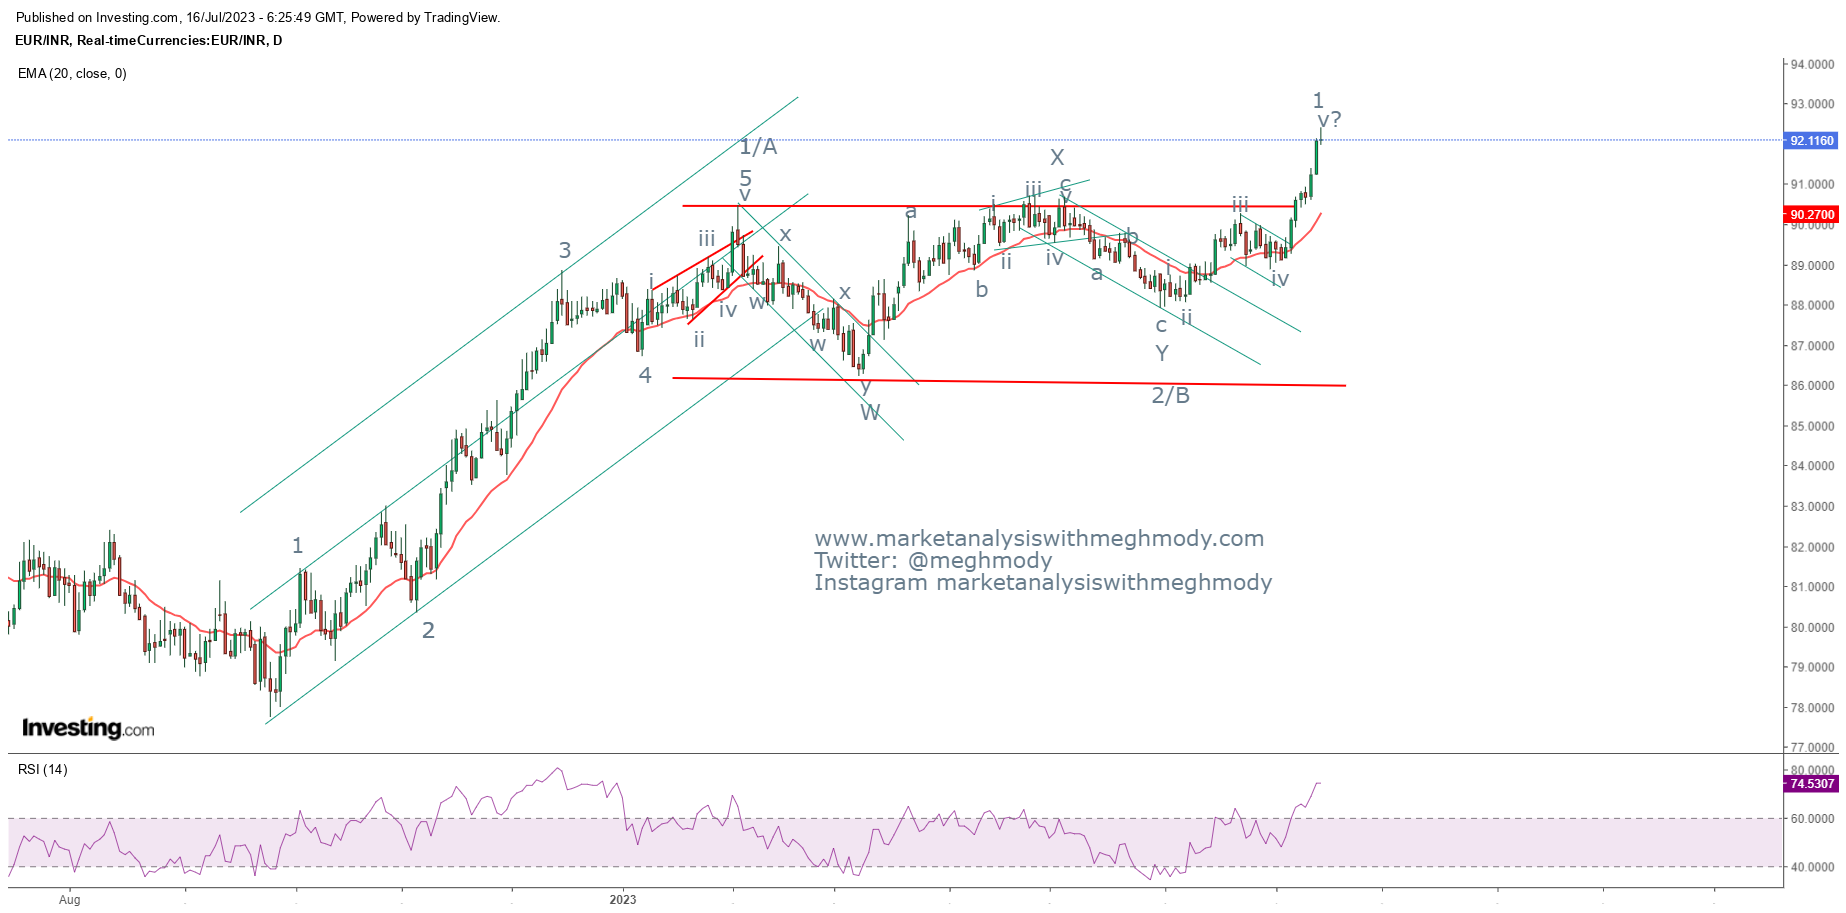
 EURINR daily chart As seen in the above chart, prices have crossed its series of tops at 91.5-91.70 levels which was acting as a crucial resistance. The pair crossed this resistance decisively and closed above it on strong footing giving an strong indication that the trend is positive and can move higher going ahead. There can be a counter correction coming into this pair which can be utilized as a buying opportunity. From Waves perspective, prices have completed wave 1/A and 2/B and has opened wave 3/C which can move higher from here. Also wave C or 3 will be impulsive in mature where wave 1 of wave C/3 is on the brink to complete that can start wave 2 lower near to 91.00 levels which can be a buying opportunity. The summation is EURINR is positively poised and can move higher once there is a dip close to 91.00 levels for the level of 94.50. Join my Telegram Channel :  https://t.me/elliottician1 Join My Twitter handle :  https://twitter.com/meghmody? s=11&t=LtKvFYlM...

Nifty Anticipated Happened

Image
 Nifty weekly chart Analysis As seen in the above chart, prices positively poised but last week it faced the resistance of 127.2% which was from highs of September 2021 till lows of June 2022. Also it is very clear that the index has formed a shooting star at the resistance of the Fibonacci which again has to be important observation. A reversal now to happen, it is important that prices need to break its previous week low of 19234 thereby opening negative possibilities.  Wave theory indicates that Nifty might have completed wave B of one higher degree at 19523 levels and can open wave C on the lower side. As of now no reversal has occurred on the charts, this can only happen once the level of 19234 is broken, which can drag prices near to 18900 levels. However, any move above 19523 will continue the uptrend. In my previous update I had mentioned that Nifty if crossed 19200 can move up towards 19350-400 levels thereby achieving my level of 19400 last week.  To read my pre...

Bank Nifty - Anticipated Happened

Image
 Bank Nifty 4 hour chart Analysis Prices are moving precisely in rising channel which is a positive sign. However, the current up move which is the impulse wave where wave 5 has come towards 38.2% from 0-3added to 4 giving an indication of a possible top. Also in the weekly chart, the index formed a gravestone doji which forms at the top giving an indication of indecision by the bulls. I think that some correction from current levels cannot be ruled out. Also the index currently holds the level of the gap which was formed during moving up. It is imperative that the index fills the gap which is placed at 44800 levels, that can open further sell off.  In my previous update I had mentioned that Bank Nifty can move higher towards 45200 once the level of 44790 is taken out and it happened what was expected.  To read my previous article click on the below mentioned link https://www.marketanalysiswithmeghmody.com/2023/07/bank-nifty.html The summation Bank Nifty can move down onc...

FinNifty

Image
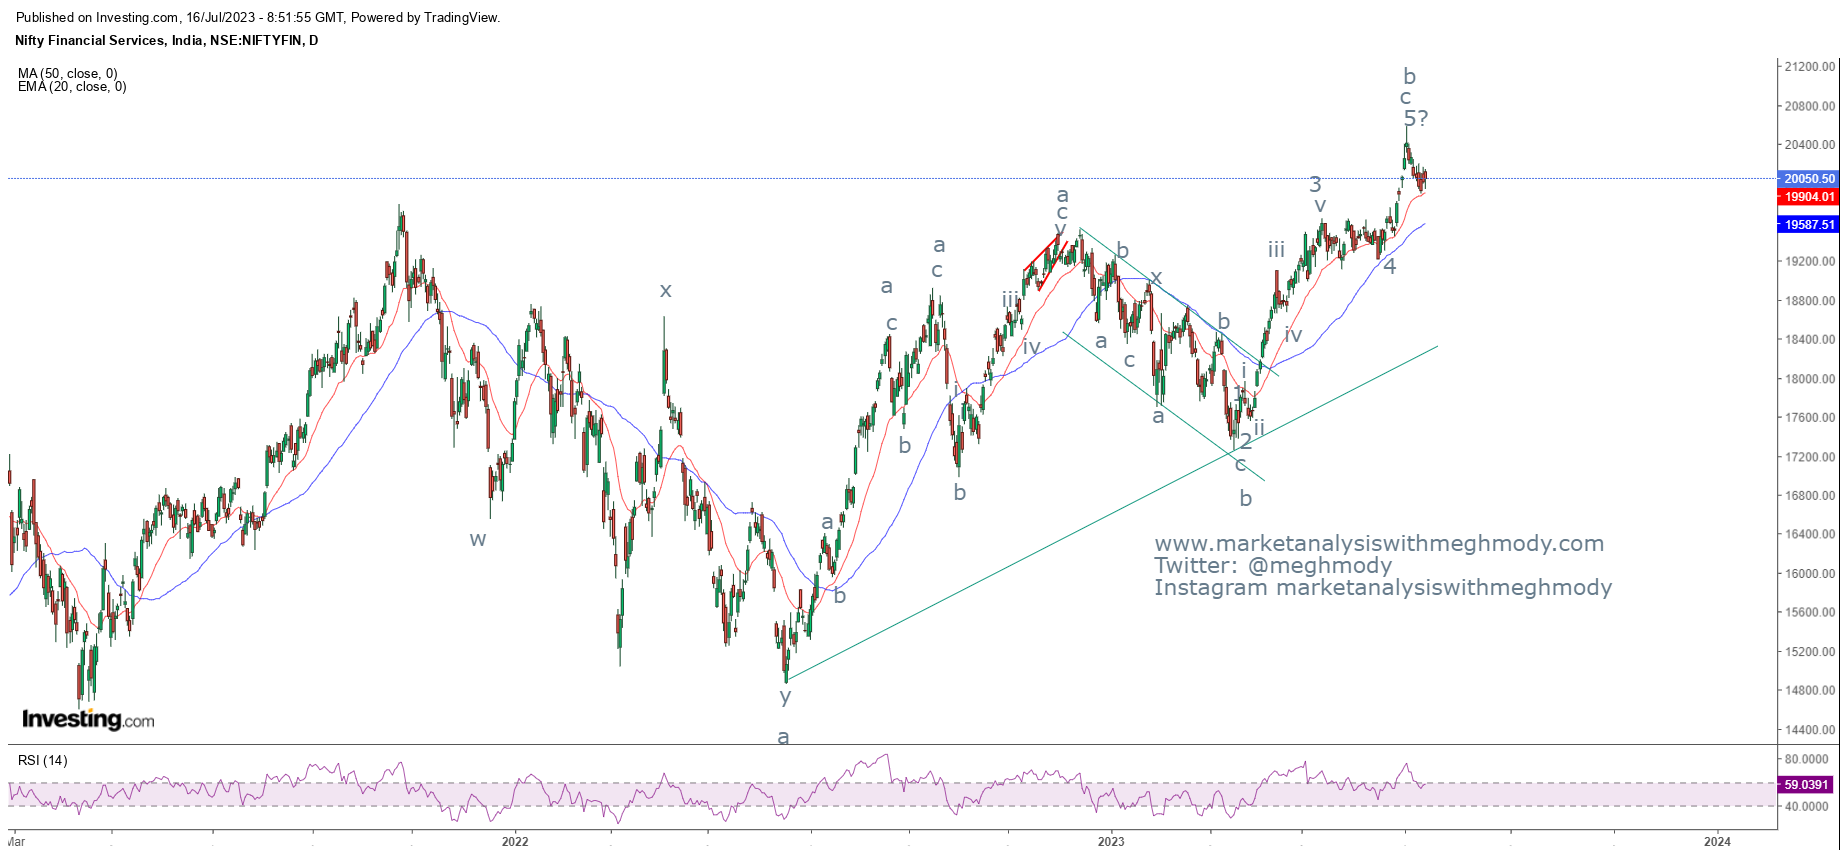
 Fin Nifty daily chart Analysis As seen in the above chart, prices have accelerated sharply in last two weeks but last week there was some kind of profit booking which could make the index stable at the highs. Also in the weekly chart, the index has formed a shooting star which is a negative sign. For a reversal to happen it is important for the index to breach its weekly low which is placed at 20053 levels. This will open negative possibilities for the index. Wave theory suggests that prices probably have completed wave b of higher degree and can start wave c on the lower side. Break of 20053 can drag prices towards 19800 levels over short term in form of wave i of wave c. The summation is Fin Nifty can reverse once the level of 20053 is broken which will infuse selling pressure dragging prices lower till 19800 levels. Join my Telegram Channel :  https://t.me/elliottician1 Join My Twitter handle :  https://twitter.com/meghmody? s=11&t=LtKvFYlMyQs71k-udwEPgQ
Bank of Baroda

Image
 BOB daily chart Analysis Prices are moving in a higher highs and higher lows but has completed five waves up which is a caution for the bulls. Also wave 5 has moved up till 38.2% from 0-3 added to 4 thereby opening the possibility of a reversal. As of no no reversal is seen but any move below 198 will open the doors for 185 followed by 170 levels. The summation is BOB is on the brink to form a top, any move below 198 will open negative possibilities which can slump price towards 185 levels followed by 170. Join my Telegram Channel :  https://t.me/elliottician1 Join My Twitter handle :  https://twitter.com/meghmody? s=11&t=LtKvFYlMyQs71k-udwEPgQ

Niikkei 225

Image
 Nikkei 225 daily chart Analysis As seen in the above chart, prices are consolidating near the top and it seems that none of the previous lows are taken out indicating that the trend continues to be positive. From Waves perspective, prices are moving in an impulse fashion and has completed wave 3 and currently wave 4 is ongoing or completed. With inverted hammer positioned at the bottom, prices are likely to open wave 5 higher which can go till 34000-34300 price range. The summation is Nikkei is positively poised and can go higher towards 34000-34300 price zone over short term. Join my Telegram Channel :  https://t.me/elliottician1 Join My Twitter handle :  https://twitter.com/meghmody? s=11&t=LtKvFYlMyQs71k-udwEPgQ

Ethereum

Image
 ETH 4 hour chart Analysis As seen in the above chart, prices are moving in a sideways direction, this can open the possibility of triangle or some other non-triangle pattern. As of now, I have opened the possibility of triangle pattern but it will negate once the level of $2200 is taken out in this move, as wave d which I have anticipated looks to be impulse as of now. Going ahead if it becomes a corrective structure then it will be more of a running triangle pattern. The summation is ETH price is likely to remain below $2200 as it can make an attempt towards $2000 levels from here and then move down till $1750 levels. Join my Telegram Channel :  https://t.me/elliottician1 Join My Twitter handle :  https://twitter.com/meghmody? s=11&t=LtKvFYlMyQs71k-udwEPgQ

USDINR still in triangle

Image
 USDINR daily chart Analysis From the above chart, prices continue to move in a higher highs and higher lows and there has been no discontinuation of the positive formation as of now. However, from past 8 months prices are moving in a stiff range of 81.50-83.00 levels with no breakout on either direction. Last week the candle was on strong footing as prices quickly recovered from the lows of 81.75-82.75 levels and closed near the weeks high which is a positive sign. There needs to be a decisive break above 83.00 levels which will open further positive possibilities for the pair to travel in the range of 84.00-85.00 levels. As per Wave theory, prices are moving in wave c of wave Z, in which it has completed wave wave 3 and wave 4 is either completed or it is still ongoing. Personally, I think wave 4 is over and wave 5 has started which can anytime move above 83.00 that can open the possibility of 84.00-85.00 levels. The summation is USDINR has high potential to cross 83.00 levels an...

MCX Crude Oil and triangle breakout

Image
 MCX Crude Oil 2 hour chart Analysis As seen in the above chart, prices which were moving in a stiff range within 5400-5800 has finally given a bullish break and also completed descending triangle pattern. The breakout was on bullish footing which is and has closed well above its previous swing high which was placed at 5972 levels. This suggests that prices are now positively poised and can move higher from current levels. From Waves perspective, crude oil prices completed wave b in a descending triangle pattern and has now opened wave c on the higher side. The ongoing up move is either extended move or possible ending diagonal pattern. This can only be concluded once it unfolds. The wave c can move upto 6800-6900 levels. The summation is MCX Crude Oil prices can move higher near to 6800-6900 price range over short to medium term. Join my Telegram Channel :  https://t.me/elliottician1 Join My Twitter handle :  https://twitter.com/meghmody? s=11&t=LtKvFYlMyQs71k-udwEPg...

Bank Nifty

Image
 Bank Nifty daily chart Analysis As seen in the above chart, prices have crossed its previous high decisively and has formed a hanging man in daily chart (candle stick pattern). This is a bearish reversal candle stick pattern and occurs at the top. However any move above 44790 levels will negate the pattern implication (candlestick) and continue the uptrend. Any move below 44666 (closing basis) will form a red candle which will be negative for the index atleast for some time. Wave theory suggests, prices are moving in wave B in which it has opened wave c which is impulse in nature. But since wave a was bigger in nature there is a high possibility of wave c to be smaller. The summation is Bank Nifty will continue its uptrend once the level of 44790 is breached which can soar prices near to 45200 levels. Any move below 44666 (closing basis) will open the possibility for correction mainly sideways to negative. Move below 44065 will make the index tumble as reversal will be confirmed. ...

Nifty

Image
 Nifty daily chart Analysis The index crossed the resistance zone of 18900 levels which was crucial. I had mentioned that once 18900 is taken out then there will be resumption of uptrend. I was negative but as soon as 18900 was taken out the bias became positive and the index made a high of 19200 levels in the same week. Prices continue to move in a positive direction negating all the negative divergence which was earlier forming. It is clear that the index will soar as far as there is no reversal on cards. RSI earlier has reversed from 75 levels (marked with horizontal line) and there is still enough room for the index to climb higher as RSI is at 72.  Now 19000 will act as a support as prices have a gap up support there and 20 period moving average is placed there. Move below 19000 can possibly open correction or else sideways to positive action can be seen. Any move above 19200 (closing basis) will catch up positive momentum for the level of 19350-400 price zone. Failure to...

Tata Power Elliott Wave Analysis

Image
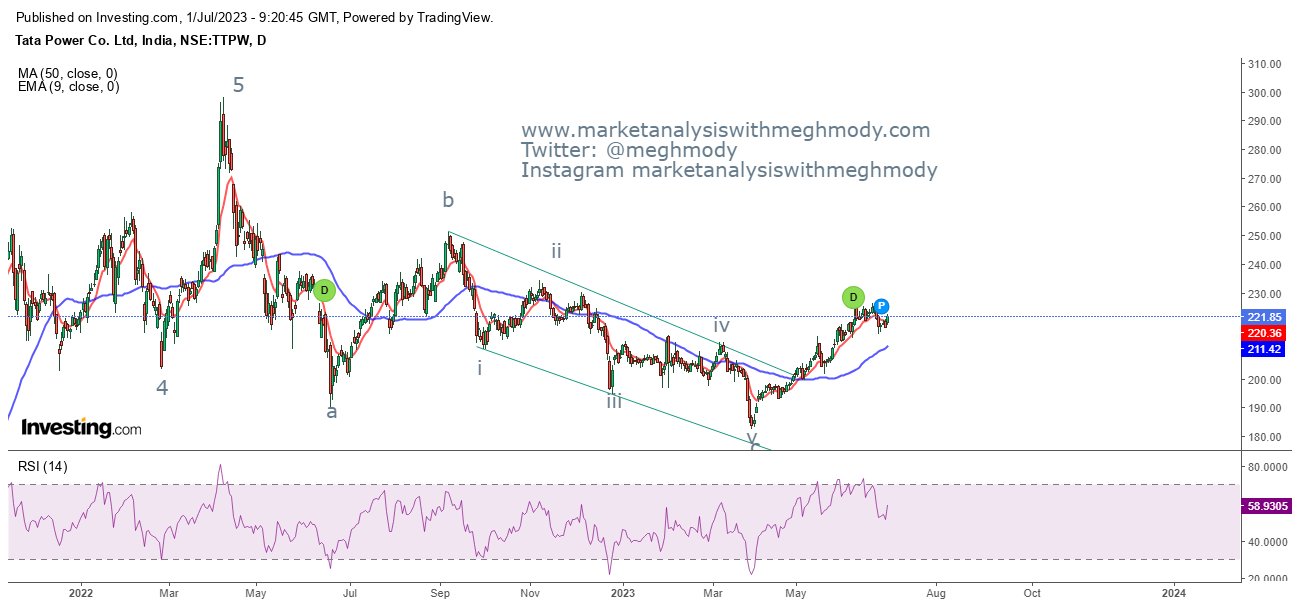
 Tata Power Daily chart Analysis Prices after moving in a positive direction and giving break in a falling wedge pattern has gone up near to 230 levels, from there it has see some kind of correction which looks to be short lived. The stock can resume the upward journey and can move near to 235-240 levels. The CMP is at 221 and the support comes to 212. From Waves perspective, prices are either moving in wave i or wave a, looking the the current upmove impulse action looks convincing but it can also convert into corrective form of larger wave b. As of now the can go towards 235-240 levels. The summation is Tata Power is likely to continue its positive momentum for the level of 235-240 price zone. Join my Telegram Channel :  https://t.me/elliottician1 Join My Twitter handle :  https://twitter.com/meghmody? s=11&t=LtKvFYlMyQs71k-udwEPgQ

US 10 Year Yields

Image
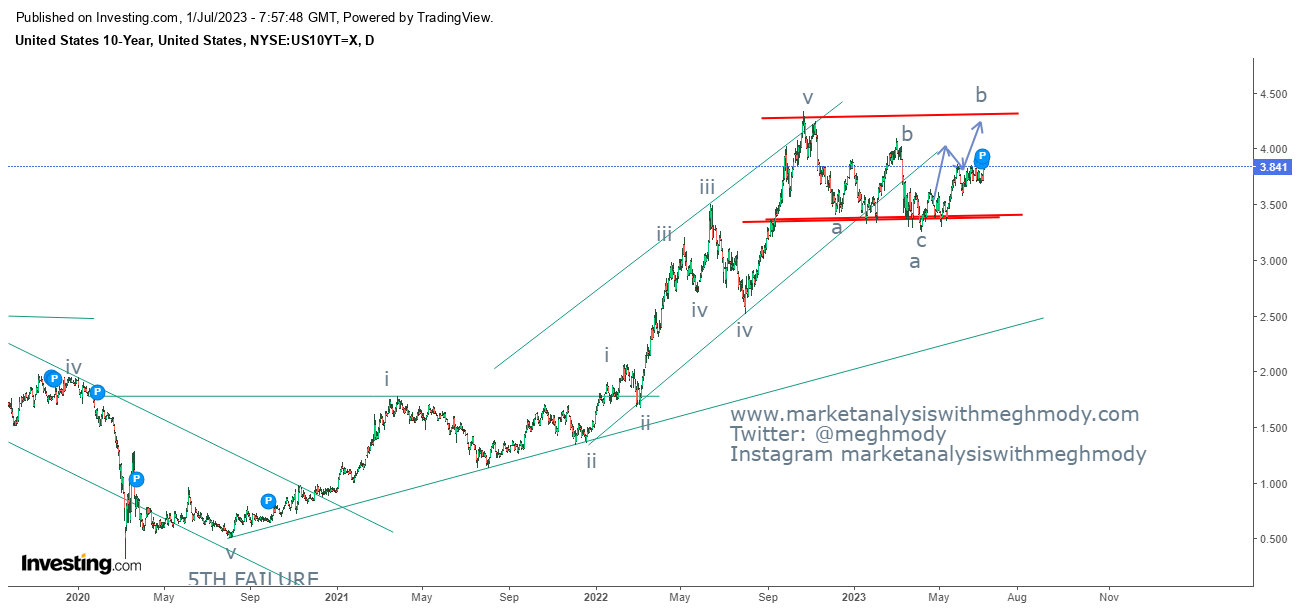
 US 10 year yields daily chart Analysis As seen in the above chart, prices are moving in a rectangle pattern with the upper and the lower extremes fixed (marked with horizontal red lines).Off lately, the yields jumped from the support of the lower trend line and it is now inching towards the resistance which is placed at 4.30% levels. Wave theory suggests, prices are moving in a flat pattern where it has completed wave a and it is currently moving in wave b which can go towards 80-100% placed at 4.30% levels.  With recent hawkish statements by the FED Chairperson Powell last week indicating hiking the interest rate atleast twice this year has given momentum to the 10 year yield and to the Dollar index (DXY). Going ahead 10 Year will be comfortable above 4%. The summation is US 10 year yields will be move near to 4.30% over short term with positive bias. Join my Telegram Channel :  https://t.me/elliottician1 Join My Twitter handle :  https://twitter.com/meghmody? s=11...

Bitcoin Anticipated Happened

Image
 Bitcoin daily chart anticipated on 18th June 2023 Bitcoin daily chart happened on 22nd June 2023 Analysis In my previous update I had mentioned that, " Bitcoin needs to move above $27500 to open further positive possibilities which can soar prices towards $33000." The crypto made a high of $31415 levels close to my level of $33000 - Anticipated Happened. To read my previous article on Bitcoin, click on the below mentioned link https://www.marketanalysiswithmeghmody.com/2023/06/bitcoin-on-brink-to-give-breakout.html Prices are moving in wave iii or can also be a part of wave ii of wave iii, but looking at the current upmove it does not look like it can be a wave ii in a flat pattern. Prices are now not only expected to test $33000 but also move higher $35000 levels going ahead, possibly in this move. The summation is Bitcoin continues to be bullish and can test $35000 going ahead. Join my Telegram Channel :  https://t.me/elliottician1 Join My Twitter handle :  https://twi...

Comex Gold

Image
 Comex Gold 4 hour chart  Analysis As seen in the above chart, prices which were moving in a rising channel is now broken thereby opening negative possibilities. Also it is now moving in a lower highs and lower lows and persisting in the falling channel. However, RSI is exhibiting positive divergence. From Waves perspective, prices have completed wave a and is now opening wave b higher, which can go towards 80% of the recent fall from $2050- $1894 levels, which comes to $2020 levels. The level of $2020 is only possible once the level of $1940 is taken out decisively. Failure to do so will negate the upside target. The summation is Comex Gold can move higher towards $2020 levels once the level of $1940 is taken out decisively. Failure to do so will continue the down move towards $1850 levels. Join my Telegram Channel :  https://t.me/elliottician1 Join My Twitter handle :  https://twitter.com/meghmody? s=11&t=LtKvFYlMyQs71k-udwEPgQ

GBPUSD - Corrective Waves to unfold

Image
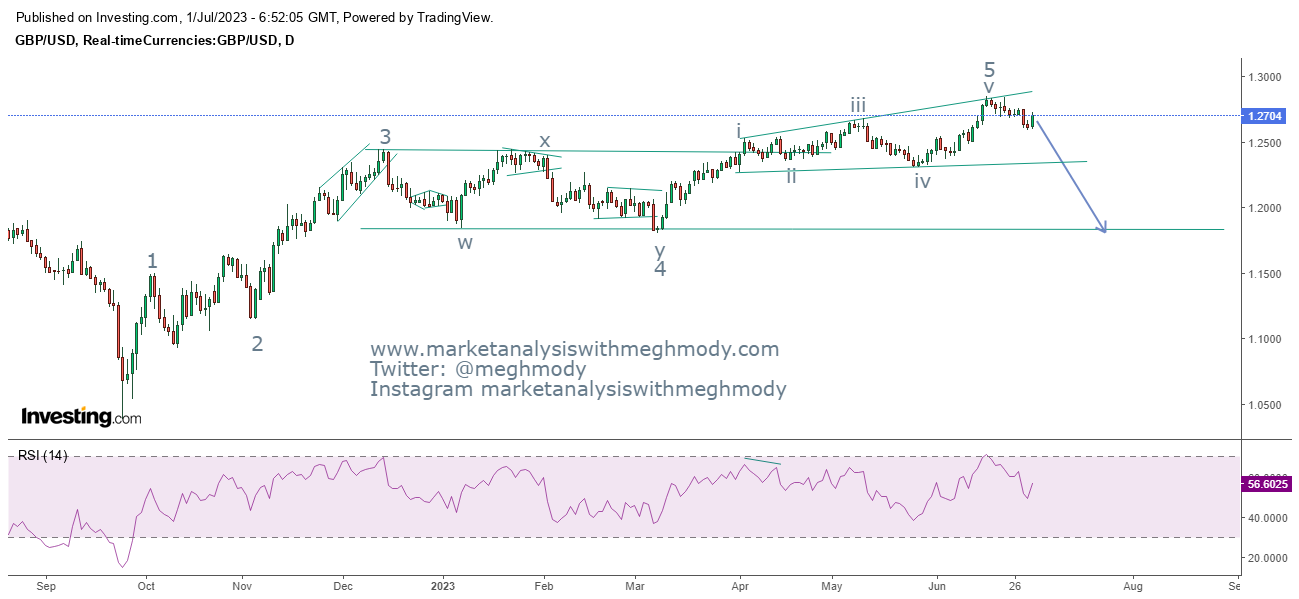
 GBPUSD daily chart Analysis Cable is moving in a higher highs and higher lows and yet it has not breached any of its previous lows which can discontinue the positive formation. As of now from past 3-4 months, the pair was consolidating with positive bias. It needs to be noted that the resistance of the trend line became the hindrance for the pair dragging it lower till 1.2594 levels. I am of the opinion that prices are poised to move down towards 1.20-1.18 price zone over medium term. As per Wave theory, prices have completed the expanding diagonal in wave 5 and has started the corrective structure which is wave a. Within wave a, wave b is in motion and then wave c lower which can test 1.2350 levels. The summation is GBPUSD is negatively poised can can test 1.2350 levels going ahead. The pair can sink towards 1.20-1018 levels over medium term. Join my Telegram Channel :  https://t.me/elliottician1 Join My Twitter handle :  https://twitter.com/meghmody? s=11&t=LtKvFYl...

PSU Banks Index

Image
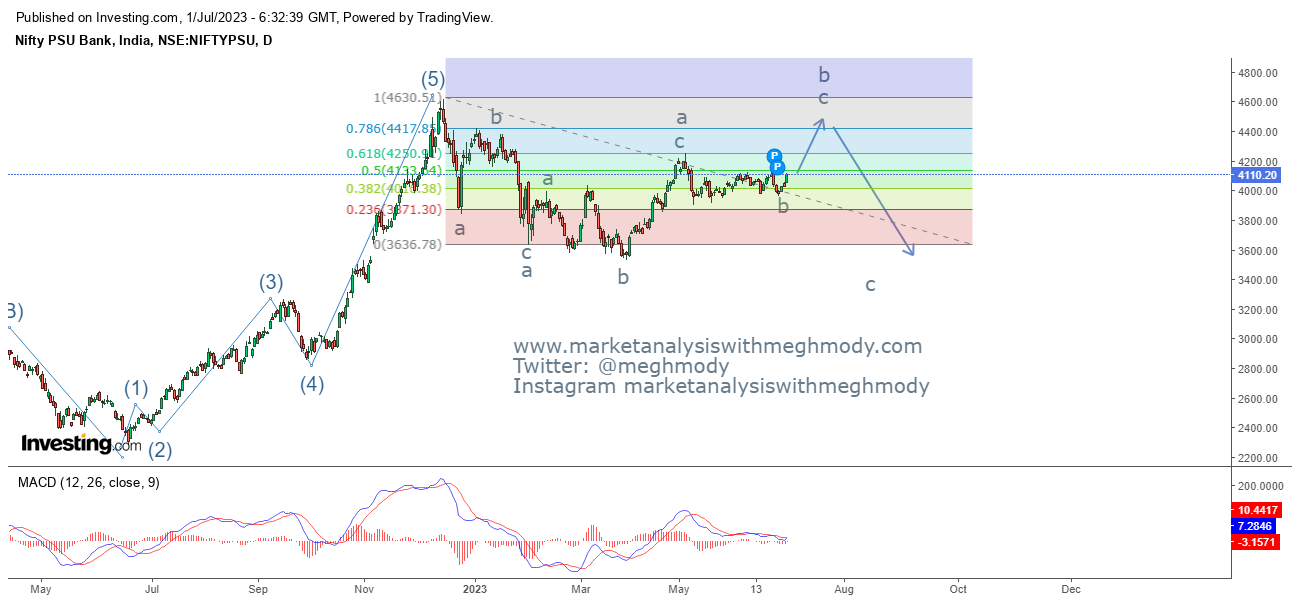
 PSU Bank Index daily chart Analysis As seen in the above daily chart, prices are moving in a sideways direction particularly in the range of 3600 on the lower side and 4600 on the higher side. Currently, the index is trading at 4110 levels and there is a high possibility that the benchmark can travel towards the upper extreme. MACD is on the brink to give a buy signal which is in sync with the positive view. From Waves perspective, the index is moving in a flat pattern (3-3-5), in which it is moving in wave B which can travel towards 80-100% of wave a which is placed at 4420 - 4630 levels respectively. In wave b wave a and wave b is over and wave c will start which will be impulse in nature. The summation is PSU Banks Index is positively poised can can travel towards 4420 levels over short term. Join my Telegram Channel :  https://t.me/elliottician1 Join My Twitter handle :  https://twitter.com/meghmody? s=11&t=LtKvFYlMyQs71k-udwEPgQ