Tata Power Elliott Wave Analysis
Tata Power Daily chart
Analysis
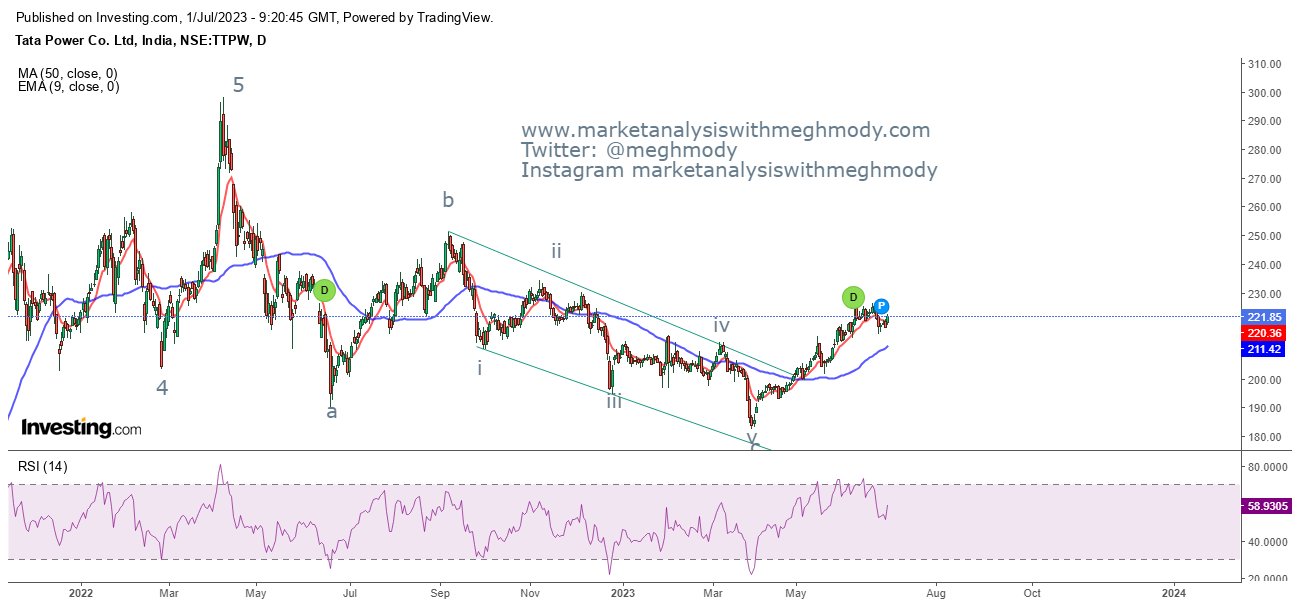
Prices after moving in a positive direction and giving break in a falling wedge pattern has gone up near to 230 levels, from there it has see some kind of correction which looks to be short lived. The stock can resume the upward journey and can move near to 235-240 levels. The CMP is at 221 and the support comes to 212.
From Waves perspective, prices are either moving in wave i or wave a, looking the the current upmove impulse action looks convincing but it can also convert into corrective form of larger wave b. As of now the can go towards 235-240 levels.
The summation is Tata Power is likely to continue its positive momentum for the level of 235-240 price zone.
Join my Telegram Channel : https://t.me/elliottician1
Join My Twitter handle : https://twitter.com/meghmody?


Comments