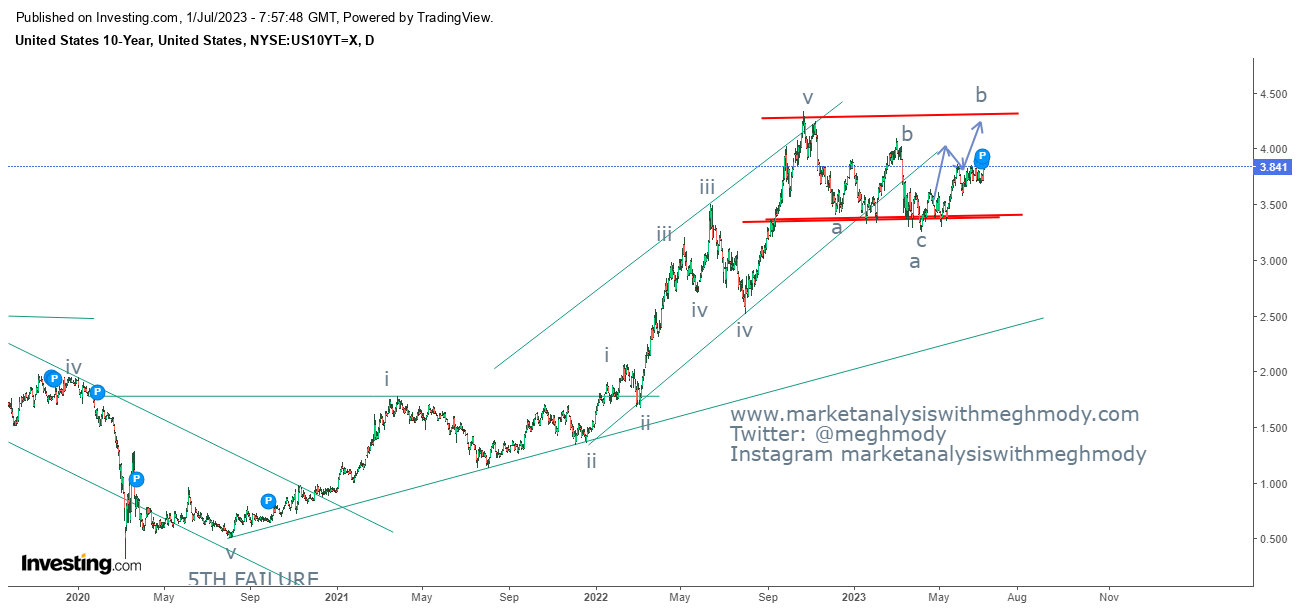
US 10 Year Yields
US 10 year yields daily chart
Analysis
As seen in the above chart, prices are moving in a rectangle pattern with the upper and the lower extremes fixed (marked with horizontal red lines).Off lately, the yields jumped from the support of the lower trend line and it is now inching towards the resistance which is placed at 4.30% levels.
Wave theory suggests, prices are moving in a flat pattern where it has completed wave a and it is currently moving in wave b which can go towards 80-100% placed at 4.30% levels.
With recent hawkish statements by the FED Chairperson Powell last week indicating hiking the interest rate atleast twice this year has given momentum to the 10 year yield and to the Dollar index (DXY). Going ahead 10 Year will be comfortable above 4%.
The summation is US 10 year yields will be move near to 4.30% over short term with positive bias.
Join my Telegram Channel : https://t.me/elliottician1
Join My Twitter handle : https://twitter.com/meghmody?


Comments