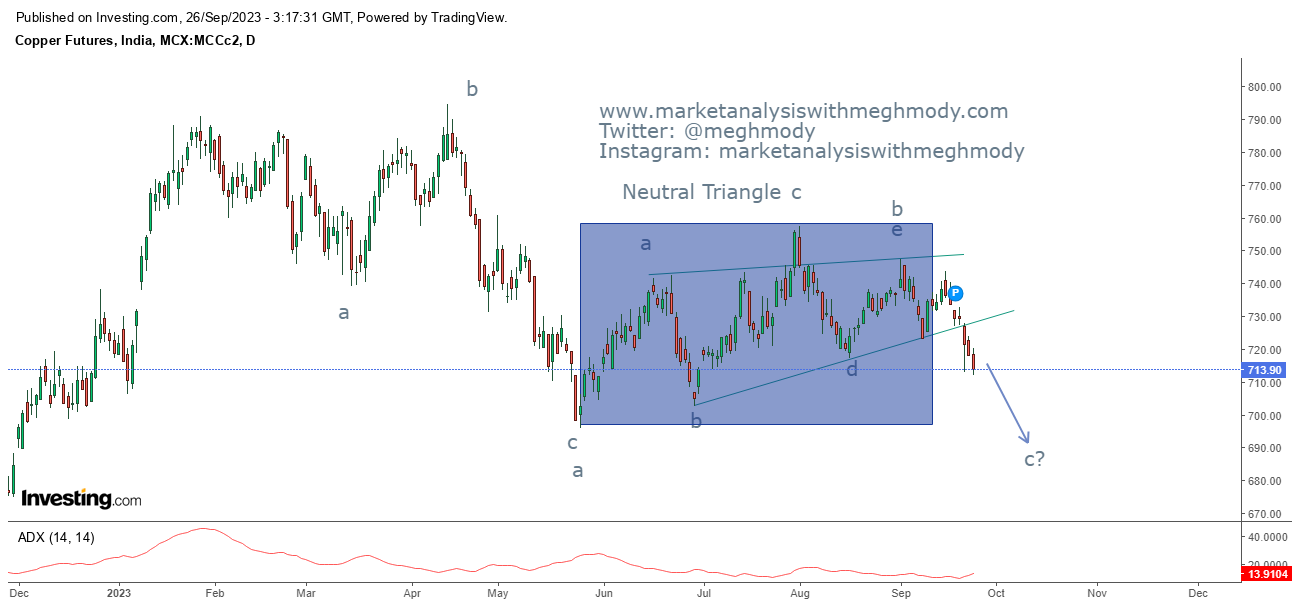
MCX Copper Neo Wave Neutral Triangle
MCX Copper Daily Chart
Analysis
As seen in the above chart, prices corrected from the top of 794 levels and made a swing low at 696 levels, thereafter it moved higher with slow momentum but could not cross its previous high of 794 levels as it topped out at 757. This concludes that the lower high is formed.
From Waves perspective, the first fall was corrective in nature (a-b-c) which completes wave a at one higher degree. The counter correction is a part of Neo Wave Neutral triangle where five legs are marked (a-b-c-d-e) this completes wave b at one higher degree and now wave c is in motion which is impulsive in nature and can move back down towards 696 levels.
The summation is MCX Copper is negatively poised and can move down towards 696 levels over short term.
Join my Telegram Channel : https://t.me/elliottician1
Join My Twitter handle : https://twitter.com/meghmody?


Comments