Posts

Nifty to climb 9200-9300 levels?

Image
Nifty has corrected by almost 4.5% from its all time high of 9119 levels. The recent down move seems to have lost momentum and it seems that the major trend for the index which is undoubtedly positive will resume. Majority of the indicators are in oversold zone and it is difficult now to say what will be the next move from viewing the indicators. In the advance version of Elliott wave theory i.e Neo wave Prices are moving in a diametric pattern. Here in this case it is Bow and Tie Diametric Pattern. It has seven legs in it (a-b-c-d-e-f-g). All the legs in this pattern are corrective in nature. Currently it is moving in a wave f and it is on the brink to complete this leg on downside, thus opening the possibilities for the next leg on upside which will be wave g. This wave g will move above its previous high. In Nifty the previous high is 9119 levels, so if wave g has to cross its previous high which wave e it will surpass 9119 levels and can possibly move up till 9200-9300 le...
Nifty to cross 9000 levels (Elliott Wave Analysis)

Image
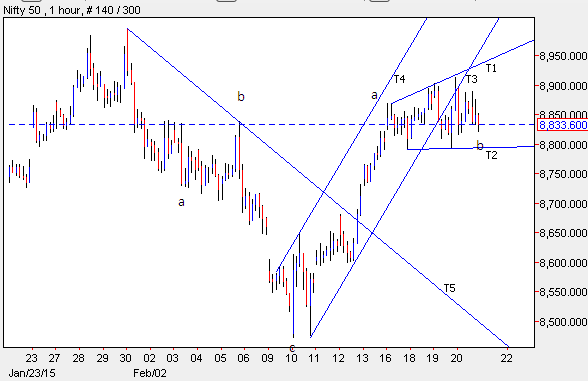
In the month of January Nifty made all time high of 8996 levels missing marginally the psychological figure of 9000. Thereafter it corrected and made a low of 8470 levels, correcting almost 5%. The index surged from the lower levels and it is now quoting at 8833 levels. From the lows of 8470 prices continue to rise by making a higher high and higher low  and it has not breached its previous day low which clearly indicates that the trend is firmly positive. As per wave perspective, prices are moving in a corrective fashion (a-b-c). From the top of 8996 prices came down in (a-b-c) and it is now moving up in three wave structure, where it completed wave a at 8860 levels. Wave b is in barrier triangle formation which has 5 corrective waves in it (a-b-c-d-e). Probably prices have completed wave b in triangle formation and it is likely it will start moving up in the form of wave c which can test its previous highs or even cross it. In short, Nifty is expected to test 9000 levels in ...

Bank Nifty to test 20900 levels (Elliott Wave Forecasting)

Image
From February 2014 till date Bank Nifty is moving in a rising channel formation which clearly indicates that the trend for this index is positive. A channel normally helps to identify support and resistance levels. Prices recently arrived near the support of the channel and has witnessed a bounce. As per wave theory, prices are moving in a triple corrective pattern (a-b-c-x-a-b-c-x-a-b-c). Recently it completed wave b at 18226 levels of the third correction and it is set to start the last leg that is wave c of the third correction. Wave b has also retraced 80% of wave a, which means it is forming a flat pattern. The third correction is a flat pattern, this indicates that wave c will touch the end of wave a or can exceed above it marginally. Thus the level of 20900 is imminent. In short, As far as Bank Nifty is moving in an upward sloping channel the bias remains positive and prices can test the level of 20900 in near term.

Gold: A reversal on cards?

Image
Gold after making a low of $ 1100 levels in the year 2014, have started protecting its previous lows and crossing its pivot highs thus opening positive possibilities. However, from past 2 weeks the rally on the upside is facing a resistance at $1300 levels.RSI on weekly chart has also reversed showing signs of reversal. As per wave theory, prices have completed one correction (a-b-c) and it is now moving up in the form of next leg on the upside.  In the current up move it has completed one correction (a-b-c) and can give a minor reversal which can drag prices lower till $1250-$1230 levels. In short, a minor wave on the downside is expected in gold which can take prices lower till $1250-$1230 levels over short term. Gold Weekly Chart

Bhel: In an expanding Triangle

Image
Triangle is always difficult to trade as prices continue to stay in a same range. However, in expanding triangle, the previous highs and the previous lows are taken out which makes traders confuse about the trend. As per wave theory, Prices are moving in an expanding triangle which have five waves in it (a-b-c-d-e). It seems that the last leg of the expanding triangle is over and the next leg on the downside will resume. Prices can test 265 levels or even lower in near term. In short, BHEL is expected to test the level of 265 or even lower in near term.

USDINR: Ending Diagonal in making

Image
USDINR was moving in a range of 62.90-63.90 for several days. After breaking the level of 62.90, the pair tumbled till 61.38 levels which was marked on 23rd January 2015. The pair has retraced to 38.2% retracement of the previous up move and gave a bearish break in the rising channel formation. However, prices have formed an ending diagonal pattern at the end of the down move thus suggesting the likely termination of the down move. As per wave theory, the rally from 58.22 till 63.90 was a double corrective rally (a-b-c-x-a-b-c). After completing the double corrective pattern, prices then moved down in a simple corrective pattern (a-b-c). It seems that the pair will not see further downfall and it is likely it will reverse from here. The pair can test the level of 62.30-62.40 levels in near term. In short as far as the level of 61.30 is intact on downside, expect prices to move up till 62.30-62.40 levels in near term.

Bharti Airtel: Last Leg of impulse wave

Image
Bharti Airtel is a telecom stock and was in an uptrend from March 2014 till October 2014. The stock then started correcting especially after discontinuing the higher highs and higher low formation and started to form a lower high and a lower low formation which is a negative sign. Prices are moving precisely in a falling red channel and will continue to do so, till it breaches or equals or test its preceding pivot low placed at 335 levels. As per Wave theory, the up move from March 2014 was a corrective move (a-b-c) where in wave c the last leg i.e. wave v was truncated. Currently it is moving down in an impulsive wave (1-2-3-4-5). Recently it completed wave iv at 367 levels and have started its last leg of impulse wave v on downside. Prices can move down till 335-330 levels in near term which will terminate one impulse wave. In short, the bias is firmly negative for Bharti Airtel as it can test the level of 335-330 levels in near term. It is imperative that the level of 367 remai...