Posts

MCX Natural Gas: Diametric formation underway

Image
In my previous update " MCX Natural Gas to halt its rally " dated 12th January 2016, I had mentioned that " Break of rising channel opens bearish possibilities, as the support of the channel is at 159, Nat Gas is expected to shed gains. Currently prices are quoting at 155 levels .  The counter wave will be a three wave structure (a-b-c) and can move in a range of 146-150 levels.  In short, expect prices to fall  till 146 levels going ahead." Nat Gas moved lower near till 138 in the month of January 2016 thus achieving our mentioned level of 146. Later it faltered till 120 levels in late February 2016. Prices are moving above the declining red channel and it is possibly consolidating above it. The bias which was also mentioned earlier is positive but will face counter rally, looks to stay for sometime. As per Neo wave, prices are forming a diametric pattern, in which it has possibly completed wave e and will move up near till 140 levels to complete wave f,...
MCX Crude poised to test 2500?

Image
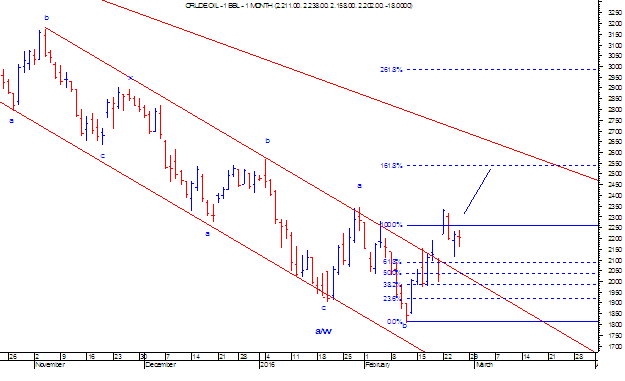
MCX Crude which was moving in a declining channel has finally given a positive breakout. However, prices still face a hurdle of 2350 levels. RSI on daily chart has also exhibited positive divergence which indicates that prices are poised to give some resilience.  From Wave perspective, the first correction was a double corrective pattern (a-b-c-x-a-b-c) which was completed at 1902 levels. The current up move as of now is a (a-b-c) pattern. Where wave c has unfolded.  This current b wave is in irregular flat pattern which has (3-3-5) waves in it. As per Fibonacci projection, the last leg of irregular flat pattern can extend till 161.8% of wave a and b, which is place at 2532. In short, a classical channel bullish channel breakout followed by throw over indicates that momentum on the up side still persist. Prices can test the level of 2500 over short term. MCX Crude Daily chart 1st month contract

Aluminium: Expanding and Contracting Diametric pattern.

Image
Aluminium, after forming a low of 94 in the month of October last year, has started moving in a positive direction. However, the upside momentum is slow and can soon move in a sideways direction. As per advance Elliott Wave theory, the recent up move is a bow and tie diametric pattern in which it has completed wave e and will now move down in the form of corrective pattern to complete wave f, followed by wave g on the up side. The previous leg was a diamond shape diametric where wave g was completed in the month of October. The current diametric formation can be termed as bigger wave x. In short, as of now prices can move down near till 101-99 levels, followed by another leg on the upside to complete one bigger wave. MCX Aluminium Daily Chart 1st month Contract.

Stealth Bear trend in Lead - Neo Wave, Elliott Wave

Image
Lead in last four trading sessions witnessed a free fall which has retraced in faster time. Prices are moving in a lower high and lower low which is a first indication that the trend is in a bear phase. Secondly it is precisely moving in a declining red channel. Lead, recently reversed from the resistance of the red channel and can possibly form another pattern.  As per Neo wave, from the fall of 2013 prices were moving in a bow and tie diametric, which has seven waves in it (a-b-c-d-e-f-g). The last leg i.e. wave g completed at 107 in the month of August last year. Then it formed a 3 wave structure which is complex in nature and has possibly ended wave x at 126 in the month of February 2016. The current fall will be wave a of another pattern which will unfold over the time. In short, prices can move down steeply near till 105 levels or even below that. A close watch is essential for this metal to understand the pattern structure. Lead Daily chart 1st month contract ...

Learn Elliott Wave Principle for free!!

Learn Elliott Wave Principle "Online" for Free on 20th of February 2016. It will be a 1 day seminar for 2 hours. Topics covered Introduction Types of Waves  Patterns Trading rules Identifying Waves Bonus  Introduction to Neo Wave The seminar will start at 10 am on 20th of February 2016. For details mail us on meghmody@gmail.com 

Nifty and Bank Nifty: Anticipated Happened and Wave forecasting.

Image
In my previous update dated 15 th October 2015 “ Nifty in an expanding triangle ” followed by “ Nifty on brink to reverse ” dated 24 th October 2015 and “ Nifty to sink after confirmation ” dated 11 th November 2015, I mentioned that Nifty will moved down to test the level of 7500 followed by 7200. In the early January 2016 Nifty made a low of 7240 thus achieving my mention levels of 7500-7200 levels. Even for Bank Nifty, my view was negative. I had mentioned that “ any move below 17430 will open negative possibilities for this index which can drag prices near till 15550 levels ” on 24 th October 2015. Bank Nifty made a low of 14754 levels on 20 th January 2016, thus achieving our mentioned level of 15550. The broader index fell to almost 8% this year and it seems that the worst is here to stay. However, there can be a reversal for both the indices over short term. As we are aware that both the indices are moving in a declining channel, forming a lower high...

MCX Natural Gas to halt its rally

Image
MCX Natural Gas has surged more than 60% from the bottom of 114 levels. It made a high of 165 in the month of January 2016. From the below daily chart, prices were moving precisely in a rising channel which is broken today giving an indication that the upside rally will halt. Break of rising channel opens bearish possibilities, as the support of the channel is at 159, Nat Gas is expected to shed gains. Currently prices are quoting at 155 levels. RSI on daily chart has exhibited negative divergence which is an indication that the positive momentum is slowing down. Please note that the larger trend continues to be positive as of now. From waves perspective, prices moved in an impulse fashion from 114 till 165 levels. After five wave structure, prices are tend to correct which is termed as counter wave. The counter wave will be a three wave structure (a-b-c) and can move in a range of 146-150 levels. In short, expect prices to fall  till 146 levels going ahead. MCX Natur...