Posts

Stealth Bear trend for USDJPY

Image
USDJPY Daily Chart After winning the upper house election Prime Minister of Japan Shinzo Abe reiterated to add more stimulus to revive the ailing economy. Market participants were expecting 10 trillion yen for this fiscal but the efforts by BOJ could not meet the expectations. USDJPY which was moving in a higher high and higher low from the start of 2012, changed the trend by discontinuing the positive formation in the month of November 2015. Thereafter, prices are moving down by breaching its previous lows. From wave perspective, after completing five waves on the upside and marking a high of 125.85 in the month of April 2015, prices have started moving in a corrective mode. The corrective mode normally takes more time before the next rally starts. As of now it is moving in a double corrective pattern, in which it has completed wave b of second corrective and wave c on the downside will start, dragging prices lower below 100. In short, bear trend for USDJPY has...

MCX Zinc: Anticipated Happened and Wave Analysis

Image
MCX Zinc  Anticipated on 1st June 2016(1st month Daily chart contract) MCX Zinc Happened on 1st July 2016 (1st month Daily chart contract) In my previous update dated on 1st June 2016, I had mentioned that " The bias for MCX ZINC remains positive as it can test 143 levels only if it sustains above 132 for considerable time" Zinc crossed the level of 132 and moved higher till my mentioned level of 143 which is 80% retracement of the previous fall. This gives an indication that the metal is moving in a flat pattern. However, the 80% retracement can also be extended till 100% or 123.6% of the previous fall, eventually ending it with regular or irregular flat pattern. It is imperative for prices to reverse sharply which will be the first indication that wave b of flat is over and wave c has started on the downside. As of now the bias remains positive for this metal.

MCX Aluminium on the brink to reverse (Wave Analysis)

Image
From the above chart of MCX Aluminium (continuous daily chart), it is visible that prices are failing to move above red trend line resistance. Apart from that, from February 2016 till date, prices are moving in a range of 100-113 levels forming a sideways consolidation pattern. As per wave analysis, prices are moving  in a barrier triangle formation from the start of 2016. The triangle pattern is bearish in nature. The beauty of this pattern is, it is formed near the resistance and can slip down near till its bottom. The target will be the width of the largest wave of the triangle pattern which needs to be measured from the breakout point. In this case it is wave a, and the break out level is below 104 so the target will be 91. However, my first level will be 104 followed by 98. In short, any sharp reversal will indicate completion of triangle pattern which will drag prices lower till 104 followed by 98 levels. The target of the pattern is 91.

MCX Crude Oil Anticipated happened and Wave forecasting

Image
On my previous update dated on 11th June 2016, I had mentioned that MCX Crude will test the support of the channel and test the level of 3100. Prices on 16th June 2016 tested the support of the rising blue channel and marked a low of 3115 which was closer to my mentioned level on 3100- Anticipated Happened. After marking a low of 3115, prices showed a strong bounce from the support of the channel. It is now expected to cross its previous high and can go even higher. As per Wave theory, the possibility for MCX Crude to move up in a double correction is showing higher probability. As it is a channelized move and it is precisely moving in a (a-b-c-x-a-b-c) pattern. After completing x it is now moving higher to start the second correction and the wave a of it. In short, expect prices to move above 3450 levels and can test 3570 levels in near term. MCX Crude 1st Month Contract (11th June 2016) MCX Crude 1st Month Contract (20th June 2016)

MCX Crude to test the support of the channel and Eliott Wave Analysis

Image
MCX Crude has shown a sharp reversal on Friday losing more than 2% and closing below the psychological level of 3300. International Crude is also facing the resistance of $50 even after the inventories reduced giving an indication that news was factored in. MCX Crude, has given a bar reversal on last Thursday and on the following day it gave a confirmation. For the downtrend to continue, it is imperative that prices should break the level of 3240 which is the  previous bottom. Breaking this level at faster pace will open the possibility of 3100 levels. From wave perspective, prices moved in a (a-b-c) pattern, in which wave c was almost equal of wave a to b. In wave c, wave iii was extended and wave v was a failure, thus giving an indication that prices will reverse soon. In short, the bias is negative for MCX Crude as prices can test 3100 in near term. MCX Crude (1st month contract)

MCX Zinc: Flat pattern to unfold

Image
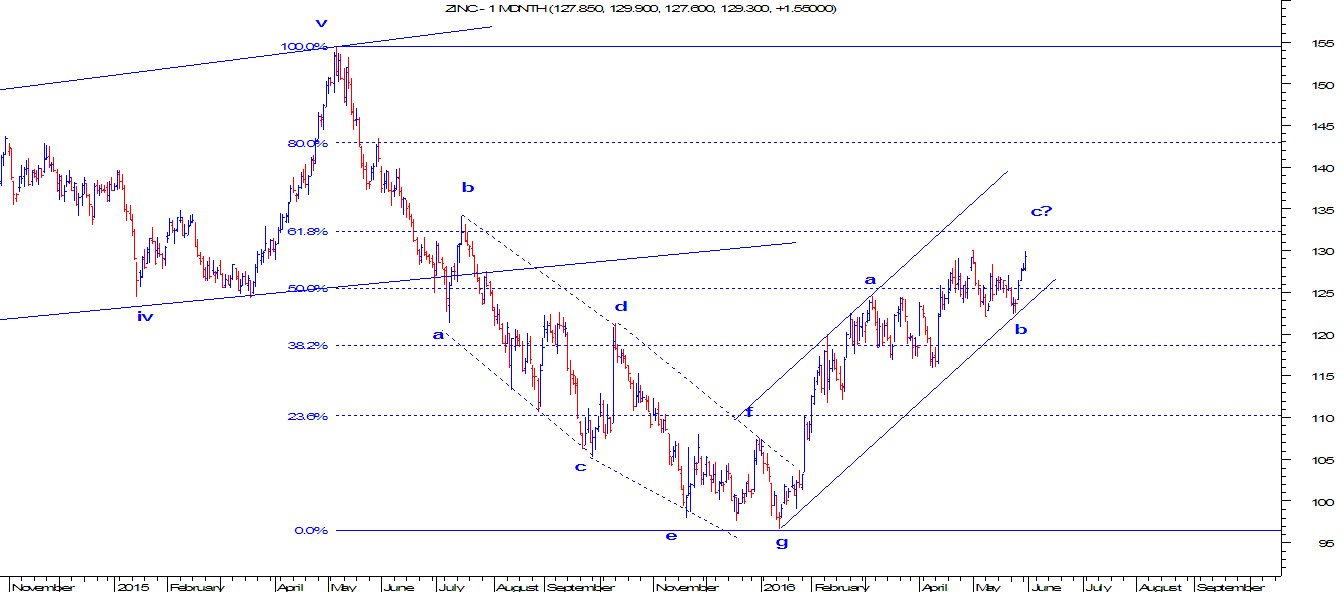
MCX ZINC is probably moving in a flat pattern (3-3-5). As of now it is moving in wave b of a flat pattern. Wave a which came down to test the level of  96.65 was in the form of diametric pattern. The current up move looks to be a simple (a-b-c).  Currently it is soaring in the last leg of wave b i.e. wave c. The momentum is very strong in wave c which can be seen clearly from the below mentioned chart. To evaluate that ZINC is moving in a flat pattern some rules need to be fulfilled. 1. In a flat pattern wave b need to move above/below 61.8%. As of now there is no sign of moving above 61.8% which is placed at 132 levels. 2. Time taken by wave b has to be more than wave a, which is still lacking. If prices move above 132 levels then there is a high possibility for prices to touch 80% retracement of wave a which is placed at 143 levels. The bias for MCX ZINC remains positive as it can test 143 levels only if it sustains above 132 for considerable time. ...

USDINR: Possible triangle in making (Elliott Wave/ Neo Wave)

Image
USDINR is moving in a rising channel formation from past two years. As per wave analysis impulsive wave cannot move in a rising channel, so only one possibility of corrective pattern opens up which is double corrective or triple corrective pattern. The first corrective pattern which starts from May 2014, has a three wave structure of wave a followed by wave b in a running triangle pattern and wave c in an impulse. The prices then came down in three wave structure to complete wave x. The second corrective wave is again in a tree wave pattern followed by wave x and currently prices are moving in a third corrective which is a possible triangle. If this is a triple corrective pattern it can also be labelled as (w-x-y-x-z). Probable scenarios of triangle: Extracting triangle (ET): In a ET which has five legs in it (a-b-c-d-e), all the major upmoves in the triangle should be smaller than its preceding up move. As of now this rule applies to the current structure. For an ET to c...