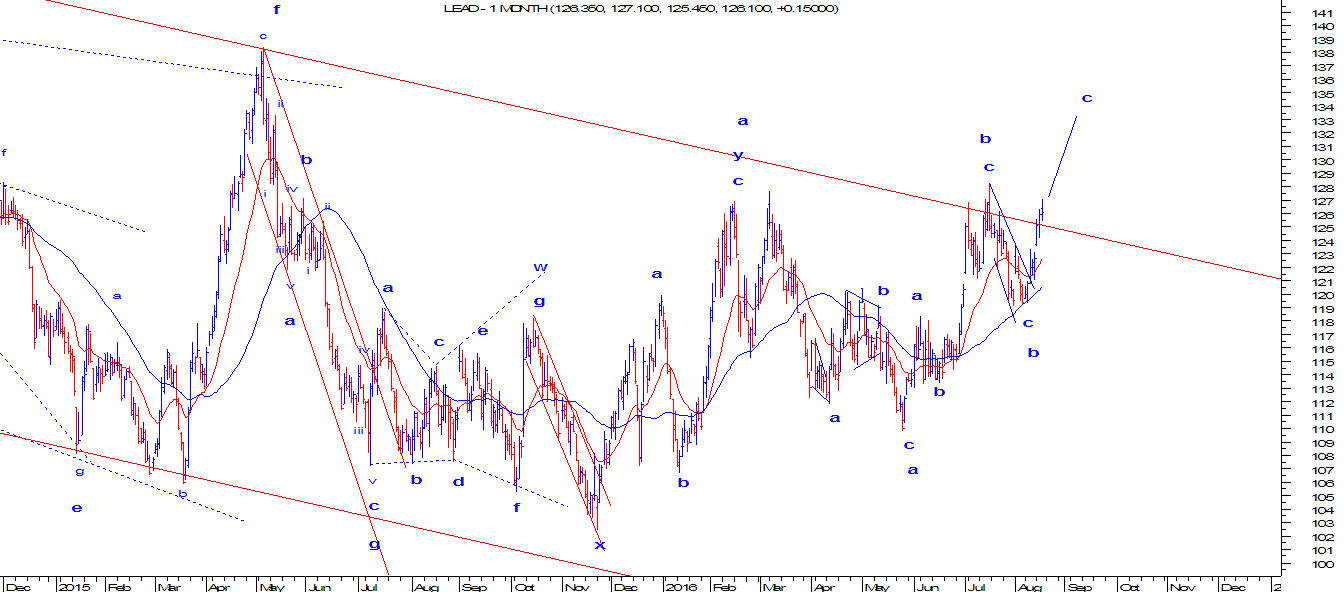
IDFC: Expanding and Contracting Diametric

IDFC is moving in a positive direction from March 2016. As of now it has protected the upward sloping blue line which is drawn from the bottom of March till date. I strongly believe that the trend lines are always meant to be broken- it is time for short term trend to change. Technically speaking, the stock have started exhibiting negative divergence in comparison with momentum indicators such as MACD, RSI etc. This is the first indication that the positive momentum is on the brink to diminish and prices are now expected to reverse. The first confirmation will be obtained when the level of 54 is broken on the downside. As per wave theory, from end of March till date, prices are moving in a complex correction. The first pattern which is a seven legged pattern (a-b-c-d-e-f-g) is a diamond shape diametric immediately followed by wave x, then there is a bow and tie diametric pattern which also has seven legs in it. Now the possibility of wave x on the downside is higher or b...


