Posts

What is Impulse Wave?

Image
What is an Impulse wave? Elliott Wave is bifurcated into two waves namely:- 1    .     Impulse Wave 2    .     Corrective Wave The waves are labeled in numbers (1-2-3-4-5) in the former wave as mentioned above. The three golden rules of impulse wave are 1    .     Wave 2 should not go beyond wave 0, it can be 100% but not below or above the origin. 2    .     Wave 3 is the longest wave in the impulse wave i.e. (1-3-5) but not necessarily. 3    .     Wave 4 should not enter in the terrain of wave 1. If all the above rules are not met, then the wave is not termed as impulse but corrective wave. Corrective wave are different and difficult to interpret. The rules are different so its guidelines. You can learn Elliott Wave and Neo wave with me on 3 rd and 4 th February 2018. A two day paid webinar covering all the details of Elliott...

MCX Copper to dip

Image
Daily Chart Continuous From past one year Copper has given significant returns as it has jumped from 310 to 466 levels. Currently it is correcting from the the recent top of 466 levels. It will be imperative to see that how much it will correct in near future and what will be the post move after correction. Neo wave theory will help to understand the impulse and corrections. From the above chart it is very clear that prices are moving higher in an impulse fashion. Wave 1 is equal to wave 3 which means there is high possibility for wave 5 to extend. Here in wave 2 a flat pattern can be seen. So now prices which are currently moving lower will not make triangle pattern but infact will fall down significantly down till 430-420 levels and will form wave iv (remember intricacy and alteration). Thereafter wave v will start and can be the longest of the three impulse waves. In short, in near future prices will correct near till 430-420 levels and then it will resume the uptren...

Caution for Small Cap traders

Image
Daily Chart Nifty Small Cap index  which is the average of 100 stocks have rallied from February 2016 till date. Many analysts are still very bullish for this index and are betting big. Looking at the daily charts many are missing small details which is shown in the chart. From the above chart, looking at the pattern one can clearly make out that the index is forming a distribution pattern. A classical wedge pattern can be seen which is also known as ending diagonal. The post impact of the wedge pattern is devastating and small caps are favorites for short selling after dramatic rise. Through wave perspective, the benchmark is forming an ending diagonal pattern which is a bearish sign. On the smaller time frame, prices are still in the last leg of pattern that is wave v (five). From here 100-200 points rally can be seen which would terminate the pattern and eventually it will reverse (as forecasted in the above chart). Momentum indicator RSI has already exhibited neg...

Hindalco: Triple Correction nearing to an end

Image
Daily Chart Hindalco and Tata Steel are one of the best performers in Nifty. However, Hindalco is now nearing to end its bull run. In the span of two years the stock surged from 70 to 270 levels which is three times and market is still positive for this stock, but it is not wise to buy at current levels. Elliott wave/ Neo wave analysis indicates that the stock is over priced and is set to reverse in near term. Classical technical tools like channels clearly shows that prices are hovering near the resistance of the channel. By combining Wave theory and simple technical analysis one can understand the movement of the stock and plausible turning point. As per Wave theory, the entire two year move is a channelized move, giving an indication that the structure is corrective rather than impulse. The pattern is known as triple correction pattern marked as (a-b-c-x-a-b-c-x-a-b-c). The first box is a zigzag, where wave c ends at 161.8% of wave a followed by x. Then  second cor...

Crude Oil poised for a fall

Image
Crude Oil (daily continuous chart) MCX Crude Oil soared last month from 2950 till 3450 levels. However, the scenario is not looking bullish due to bearish signals forming at the top along with the negative follow up. As per the candle stick pattern, prices formed an engulfing pattern at 3450 levels and on the following day prices continued the negative momentum.  According to wave theory, the rise from July 2017 till the top of 3450 is corrective in nature ( 3 wave). The possibility for prices to be in a running triangle are likely and so wave e on the downside is expected. So if wave e is pending on the downside, prices will test 2900-2800 levels. As of now, expect prices to test the level of 3150 over short term as far as the level of 3400 is intact on the upside.

Decoding Nifty ahead of RBI policy

Image
Nifty (Daily Chart) Last week Nifty fell 2% from the all time high of 10179 levels. Mid caps and small caps eroded all the recent gains which eventually ended up in a pain.  This week there is an RBI policy meet  lined up and looking at the recent momentum of the benchmark it is quite visible that the negative trend will continue. Nifty as of now have not broken any of the previous lows. Last week it made a low of 9687, thus protecting its previous low of 9685.  However, looking at the current structure it is possible that several supports are likely to be broken. As per wave theory, after making a high of 10179, prices fell in an impulsive fashion which was completed when it made a low of 9687. The recent 3 day up move is corrective in nature and can be wave ii of wave c on the downside.  According to Fibonacci projection prices have retraced 100% of wave a. Wave c can extend till 161.8% of wave a which can move down till 9500 levels in near te...

Aluminium: Triple Correction to end

Image
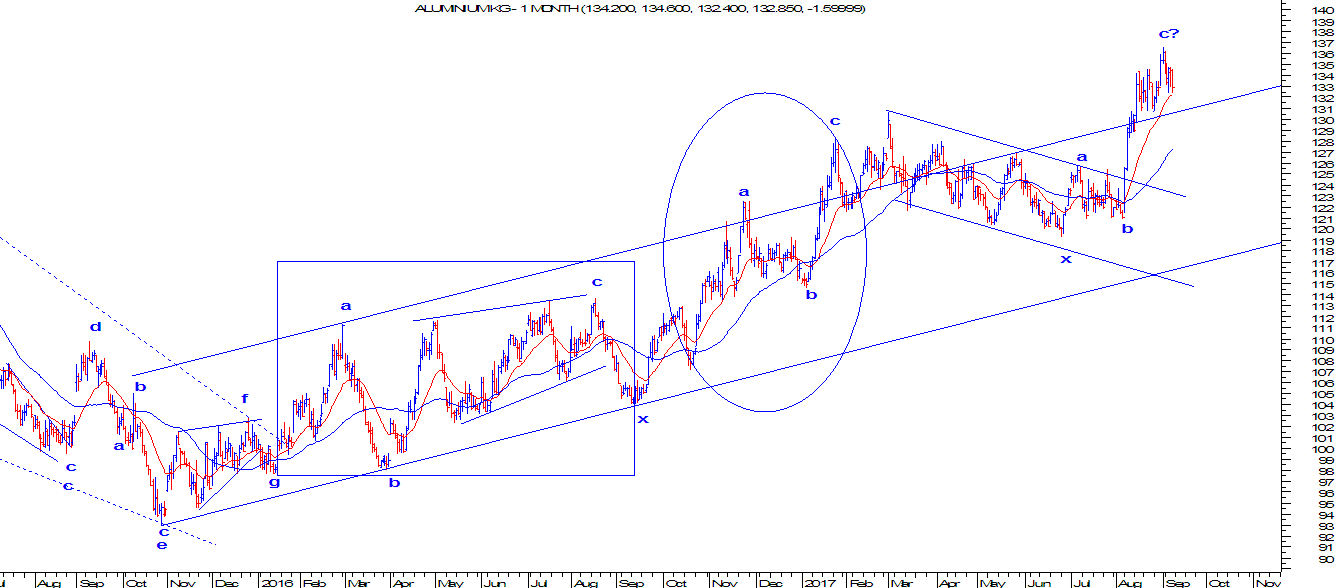
Daily continuous chart of Aluminium Aluminum is a laggard in price movement  as compared other base metals. However, it seems now that it is nearing to a completion of a pattern. Pattern typically known as Triple correction in Elliott wave theory. Triple Correction (a-b-c-x-a-b-c-x-a-b-c) has two wave x and three a-b-c, normally this pattern occurs when simple a-b-c is unable to reach the target. The first (a-b-c) shown in a rectangle is a flat pattern followed by wave x. The second (a-b-c) shown by circle is a simple zigzag followed by wave x and the third is either wave a of wave a quoting at 132 of it is on the brink of completing in a flat pattern. A move below ... will give an indication that third correction is completed and prices are set to reverse. The correction will be steeper and will be here to stay. The resistance is at ... any move above this level will give an indication that third correction is going on.