Posts

Nifty Weekly Analysis on 3rd Sep 2019 Video

Nifty analysis, chart patterns, trend lines, higher highs and higher lows, Technical pattern calculation, trend reversal if any All in one Click on the link https://youtu.be/K5rr0MaL08Q

Nifty Weekly Analysis on 3rd September 2019

Image
Nifty Daily Chart From the above chart, Nifty has given a bullish break in a falling blue channel, giving a positive indication. After giving a positive break, last week it sustained and closed above the channel. At present it is facing resistance of 11045, which once crossed can see further buying taking index much higher. My wave counts from current fall to recent high is shown in the above chart. I have shown two wave counts  1. a-b-c  2 a-b-c-x-a-b-c Both of the above counts suggests that one higher degree fall is over and a breather or a reversal is due which Nifty has already given. It is difficult to come to a conclusion that last week move is a reversal or a relief rally. The recent up move is so marked as (a-b-c) as of now. In this pattern wave b has retraced 61.8% of wave a and will open wave c higher which can take price till 11180-11200 which is 61.8% of wave a to wave b (Projection). So if everything is correct Nifty will move higher to achie...

Nifty Anticipated Happened and forecast

Image
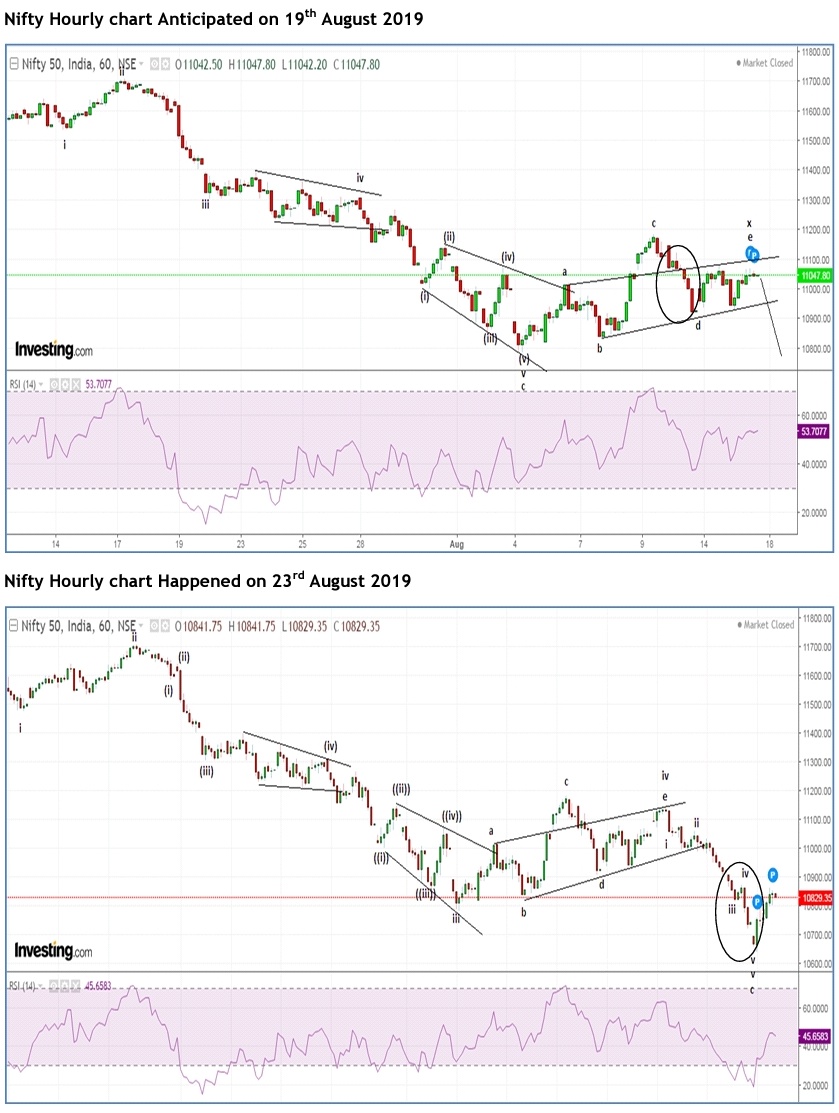
Nifty hourly chart In my previous update dated 19th August 2019, I had mentioned that, “Nifty will continue to face resistance of 11180-11200.As far as this level is intact, the index is set to dip near till 10700-10650 levels, once 10900 is broken decisively.” – Anticipated Happened.  The index on Friday opened with a gap down and made a low of 10637 thus achieving my level of 10700-10650 levels. After making the intraday low prices shot up and closed above 10800 levels. In the above hourly chart, prices have shown signs of a bounce back but I will not say that a reversal has happened this is because there is no price confirmation. Prices are still trading in a falling black channel as seen in the daily chart. As far as prices persist in this channel the bias is still negative. Over short term it can bounce near till resistance of the channel which is placed at 10900-10930 levels. Any move above this level will give a bullish break in a falling channel pattern....

Nifty Bank: Five waves down

Image
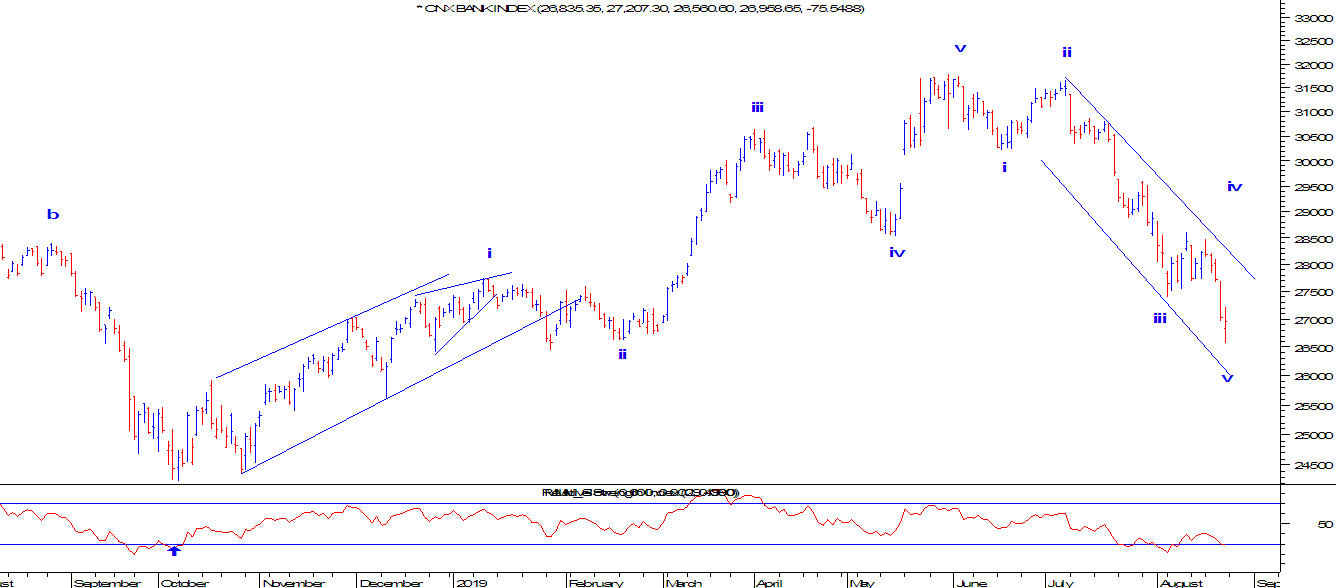
Nifty Bank Daily chart In the above daily chart, Nifty Bank is near support of the falling channel. There are chances for the index to move higher as RSI is exhibiting positive divergence. Also if you observe prices had found support near the horizontal line which was providing support to this index earlier as well. As far as 26500 is protected on the downside, it is likely that the index will move in a positive direction which can test the previous highs placed close to 28000 levels. As per wave theory, prices have completed five waves down, this is an indication that a reversal is due which can soar price at least 61.8% of the previous fall which comes to 29800 levels. This scenario is only possible if prices are moving in a zigzag pattern (3-3-5). The second scenario is, if prices are moving down in an impulse then 38.2% is where wave ii will be completed which is placed at 28500. The summation is, prices are likely to give a bounce which can surge price till 28000...

How to identify Impulse wave of Elliott Wave

I have explained the golden rules and few other techniques of how to identify Impulse wave of Elliott wave. You all can check the short version in the below video. Click here https://youtu.be/BUDtbASFVJ4

Nifty Weekly Analysis on 19th August

Image
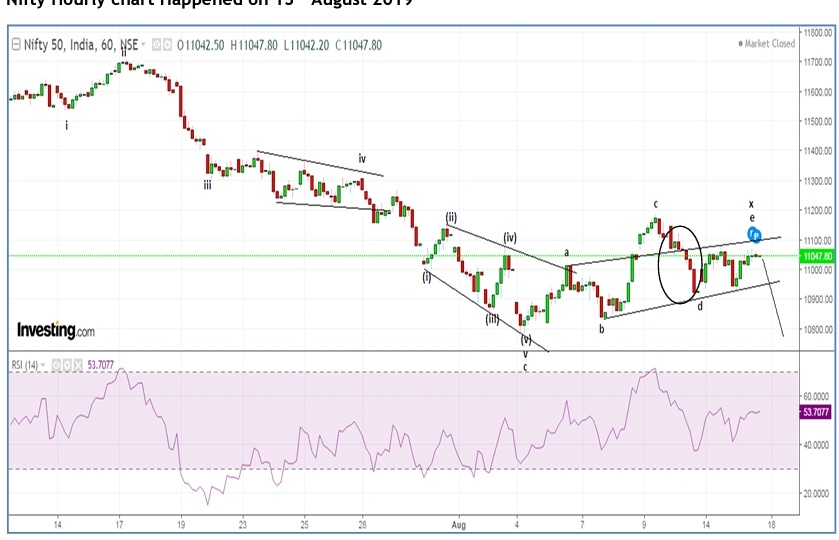
 Nifty hourly chart In the above hourly chart, the index moved more in a sideways pattern with no directional move within range of 200-250 points. The support of 10900 and on the upside it faced resistance at 11180-11200 levels. For a directional move to emerge it is important that prices should move above 11200 or break below 10900 decisively.  Wave theory suggests that, prices are moving in a Neutral Triangle pattern which is a Neo Wave pattern. The pattern has five internal legs (a-b-c-d-e) but here wave c will be the longest amongst wave a and wave e. The pattern looks to be completed and prices are set to falter. Any move below 10900 will open further negative possibilities which can drag prices till 10700-10650 levels. The resistance will be at 11180 levels.  The summation of the above three charts is, Nifty will continue to face resistance of 1180-11200.As far as this level is intact, the index is set to dip near till 10700-10650 levels, once 10900...

MCX Copper: Channel Breakdown

Image
MCX Copper 60 mins chart Dr. Copper was moving precisely in a rising channel but the positive momentum was halted once this channel was broken. This is an indication of reversal in price action. The metal is also trading below both it's short term averages on hourly basis indicating negative trend to emerge. The summation is with break of channel and it's previous low, prices are more likely to sink.