Posts

Bitcoin: One higher degree

Image
Daily Chart Bitcoin, has completed wave B in a triangle pattern below 61.8%. This means wave C in an impulse have started which can drag price lower till end of wave A. So if prices come back to 3000 levels  I will not be surprised. Learn Elliott wave and Neo wave analysis. A two day paid Webinar running by over 15 hrs and the fees for it is 15000/- don't miss this opportunity. For registration call 9324174580.

MCX Silver: Technical Analysis explained

Image
Technical Analysis course to start from  13th October. A three month course scheduled every Sunday. Start the course from inception. The fees will be 15000/- . For registration call 9324174580.

Nifty: Flag pattern on the way?

Image
Technical Analysis course is going to start from 13th October which will run for more then 3 months. It will be scheduled on every Sunday for more then 3-4 hours. Learn Technical Analysis from inception. The fees will be 15000/- per person. Grab this opportunity and be a Technical analyst by yourself. For registration call 9324174580 Nifty Video

MCX NatGas Video

Image
Technical Analysis course is going to start from 13th October 2019. A course which will be of more than 3 months, scheduled every Sunday for nearly 4 hours. Interested candidate can call on 9324174580 for registration. The fees will be 15000/- per person. MCX NatGas

MCX Crude: My Elliott Wave Forecast

Image
This forecast was made on 23rd September. I have been saying that I am not bullish for Crude now after it made a high of 4500 levels. You can read the below excerpt but before that if you want to learn Elliott Wave and Neo Wave which is a two day paid webinar, you can. It will be over 15 hours session in two days and the fees will be 15000/- From above hourly chart,prices are now moving in a lower high and lower low after marking a high of 4500 odd levels. The lower highs and lower lows will not favor prices to rise from current juncture. As per wave theory, prices have completed wave b at one higher degree where the internal counts were (w-x-y )eventually .... pattern as it retraced more than 80%of the previous fall of wave a(4692-3522). So if wave b is over wave c has already started which is an impulse in nature and can move down till ..... Don't follow the crowd blindly, think objectively and trade. Learn Elliott Wae and Neo wave. For registration call 9324174...

German DAX: Will slowdown drag the index?

Image
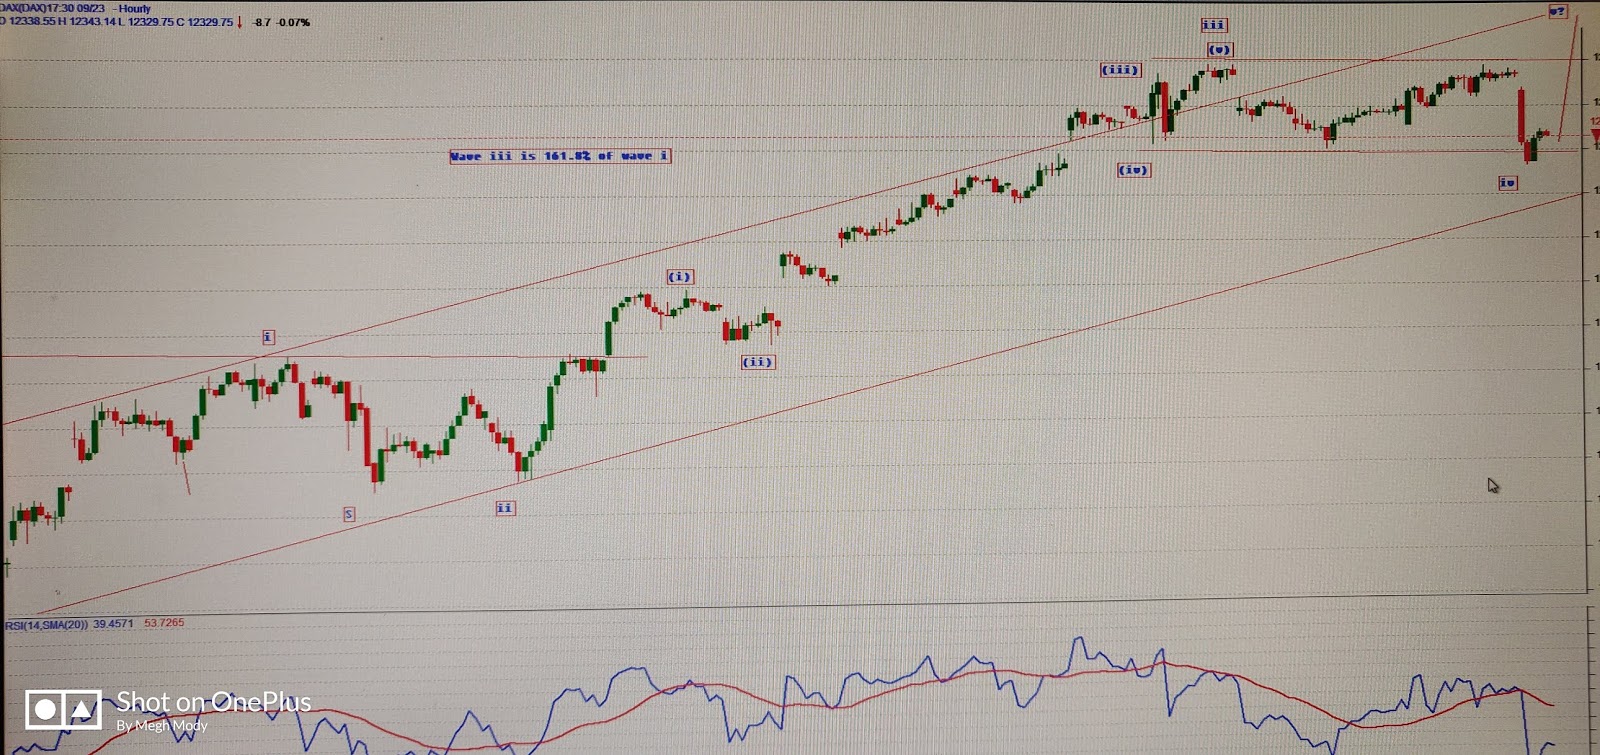
DAX Hourly chart German DAX is moving precisely in a rising channel formation which is a positive formation. Today in the opening session it tumble by over 1 % giving on the fear of German slowdown as it's PMI fell to it's 7 year low.  Elliott Wave does not say that the top is formed. I have placed my wave counts in the above chart where I have marked the current rally as an impulse in which today wave iv was completed and in short time wave v will go up till 12600 or close to that. Learn Elliott Wave and Neo wave a two day paid webinar with cost of 15000/- covering all the important concepts and theory running by over 15 hrs. For registration call 9324174580.

Bitcoin: Price forecast

Image
In the above hourly chart, a two converging trend lines are drawn in which prices are moving within, giving an indication that symmetrical triangle is forming. In a triangle pattern the requirement is, there needs to be two touch points on both the trend lines. In this case the requirement is fulfilled.  From waves perspective, a triangle needs to have five legs within (a-b-c-d-e). All the waves in the pattern is corrective in nature. In the above case wave d is completed and wave e has opened, this wave e is not may or may not touch the lower trend line. So I expect that prices should fall in a range of 9700-9600 levels where wave e will complete. After completing wave e lower which will also complete wave b on one higher degree. Prices are expected to start wave c higher which can be 61.8% or 100% of wave a of one higher degree. So prices can move till 13390 and or 15780 respectively. The summation of the above chart is, the bias for Bitcoin is firmly positive. The...