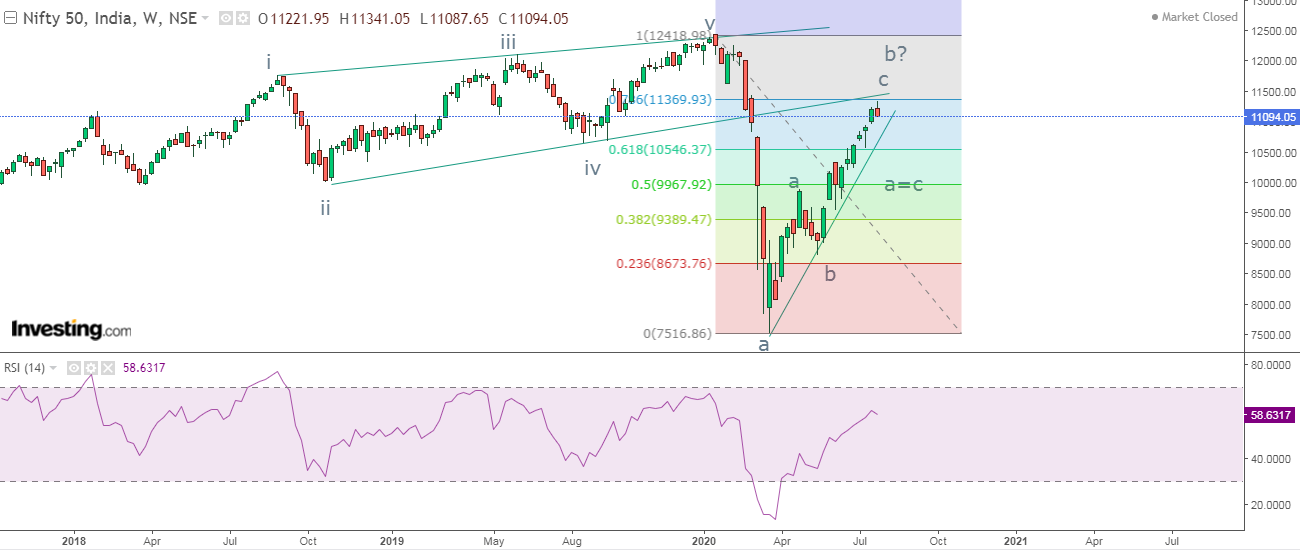
Nifty Weekly Elliott Wave Analysis

Nifty Weekly chart Nifty is moving up steeply opening up the possibility of a 'V' shape recovery or a next bull run. Many traders and investors are sure about a new high coming soon. However, by combining traditional technical analysis with advance technicals, my view for the index is presented below. I have taken weekly chart to explain my analysis, as last time I had explained it on daily chart where I was sure that it will not cross 11050, but it did. In the above weekly chart, prices are moving in a higher highs and higher lows which is a positive sign but on expiry day (July series), the index made a high of 11300 and reversed, closing at 11100. Now doubt, prices are trading above the rising trend line which is a positive sign and shows that the trend is intact, but it is facing the resistance of the ending diagonal or rising wedge pattern. This means the index is hovering at the lower trend line of the pattern, which is seen in the chart. With the help of Fibonacci retrac...


