Posts

Nifty Elliott Wave Analysis
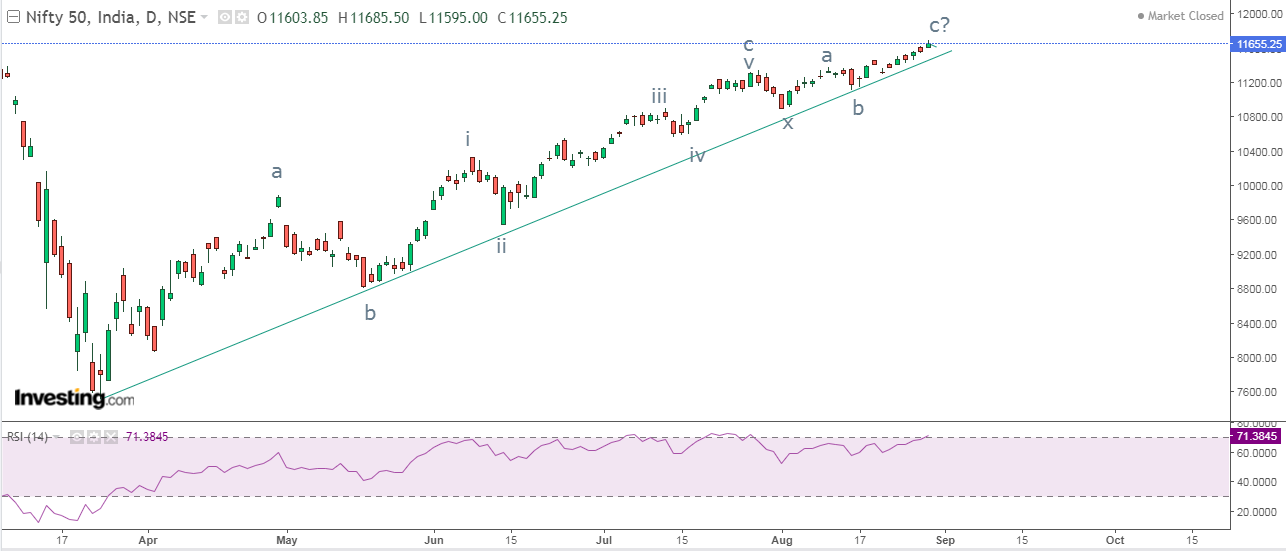
Image
  Nifty daily chart Nifty hourly chart In my previous update, I was sure that 11520 will be the resistance but it surpassed thus negating my view of 11200 a lower level. In the daily chart, the index continues to move in stealth uptrend by crossing its previous day high and making a new one. Last week market made a new high of 11693 and closed near the high of the week at 11655. As of now prices continue to trade above rising trend line and there is no discontinuation of higher highs and higher lows which makes this index firmly positive. However, RSI continues to give whipsaws near the overbought zone. As shown in hourly chart, last week there was no correction in the index and as such there is a high possibility for a correction to come, this correction can be sideways to negative but it is unlikely to breach 11450 levels. RSI is near 70 from where overbought zone starts. As per Wave theory, after completing wave b at 11114 prices have started wave c in which it has complet...

Larsen and Toubro Elliott Wave Aalysis

Image
  Larsen & Toubro daily chart Larsen & Toubro hourly chart From daily chart, prices are moving in a higher highs and higher lows, ten trading sessions back it has crossed its previous high which opens further positive possibilities. After making a high of 1026, it retraced back near to the horizontal line which was earlier acting as a resistance, will now be a support (polarity reversal).  The rising trend line is also playing a crucial role by providing support to this capital good stock. From there a sign of resilience is seen. RSI in the daily has relieved from the overbought and is set to move higher from current levels. In the hourly chart, LT was trading below the falling black trend line but on Friday it crossed this trend lie thus giving a bullish break and at the same trading day there was a throwback where it re-tested the trend line (black). MACD is positively poised and can move higher as far as it is above the signal line. As per Wave theory, prices have c...

EURINR: Terminal Impulse (Leading Diagonal) Elliott/ Neo Wave Analysis

Image
EURINR daily continuous fut chart EURINR hourly continuous fut chart In daily chart of EURINR, the pair is moving higher in a rising wedge shape pattern which is a bearish reversal pattern. However, there is no price breakout yet, once there is a price confirmation, prices are set to falter. RSI is also exhibiting negative divergence which is a sign of caution. From hourly chart, prices are moving in a rising channel (shaded portion) indicating that the trend is firmly positive and it has arrived near the support. This support zone of 87.50-87 needs to be broken decisively which will infuse selling pressure dragging it near till 84 levels. RSI is relieving from the oversold terrain and is set to resume the downtrend once there is price confirmation. From Waves perspective, prices are moving in a leading diagonal as per Elliott Wave and terminal impulse as per Neo Wave. Here wave iv has overlapped wave ii (rule of impulse as per Neo Wave) and part of wave i (Elliott Wave) and therea...

Nifty Bank: Anticipated Happened and Alternate Wave Count

Image
 Nifty Bank daily chart anticipated on 4th August 2020 Nifty Bank hourly chart happened on 26th August 2020 In my previous update on Nifty Bank, I had mentioned that, " Nifty Bank can reach till 23300 levels which will be immediate resistance with support at 21000 (closing basis)." Today, the index surpassed this level thus achieving the 23300- Anticipated Happened. Here is the link on my article on Nifty Bank click on it https://www.marketanalysiswithmeghmody.com/2020/08/nifty-bank-elliott-wave-analysis.html I have opened another possibility for this index as earlier I was thinking as (a-b-c-x-a-b-c) but I had also opened wave x/b in my previous article. This means that wave c on the upside was pending and so as wave a after wave x. So here wave c is quite likely as the structure looks impulsive and can move up above 25000 in coming weeks. The summation is as far as 22500 is intact on the downside, prices are likely to reach till 25300 levels in near term. Education Learn Te...

TATA Motors Anticipated Happened

Image
 Tata Motors hourly chart Anticipated on 15th August 2020 Tata Motors hourly chart Happened on 26th August 2020 In my previous update dated 15th August 2020, I had mentioned, " Tata Motors will find support at 120-122 levels which can be utilized as a buying opportunity with support at 114 (closing basis). On the upside that stock can test 134-136 levels." Today it surpassed 134-136 zone thus Anticipated Happened. Here is the link of my previous article of Tata Motors click on it https://www.marketanalysiswithmeghmody.com/2020/08/tata-motors-elliott-wave-analysis.html I was very clear that prices will take support at 122-120 price zone which was earlier acting as a crucial resistance, once this level was taken out  it will now act as a support (polarity reversal). Also I had mentioned that it will be a buying opportunity with stop of 114 (closing basis). The stock never went below 120 and from that level it achieved my target of price zone 134-136, thus gaining 13% in 7 tradi...

USDINR Anticipated Happened

Image
 USDINR hourly fut chart anticipated on 9th August 2020 USDINR hourly fut chart happened on 24th August 2020 In my previous article dated 9th August I had mentioned that, "P rices are set to plunge in order to test the support of the falling small channel which comes to 73.8-74 levels and the resistance will be at 75.8 (closing basis)." - Anticipated Happened Today it made a low of 74.0250 in futures which was close to my mentioned target, I was bearish from 75.13. Here is the link of my previous article, click on it. https://www.marketanalysiswithmeghmody.com/2020/08/usdinr-elliott-wave-analysis In the afternoon, the Fiance minister announced a relief by exempting business upto 40 lakh annual turnover from GST, after that many Fundamental Analyst became bearish, but Elliott Wave with combination of Technical tools were giving bearish signal in the start of the month. I had anticipated that wave x after second correction was over and so wave z will come down to test the lower...

MCX Lead Elliott Wave Analysis

Image
 MCX Lead daily continuous chart MCX Lead hourly continuous chart As per daily chart, MCX Lead is trading above the rising trend line which is a positive sign. There is a crucial support of 150 for the base metal. Only a move below this level will infuse selling pressure which can drag prices way lower. As far as it is trading above this trend line the bias is positive. However, RSI is exhibiting negative divergence which is a cautious sign. From hourly chart, higher highs and higher lows are intact and recently it has come down to re-test the trend line support. Moreover none of the previous lows are taken out which makes this metal strong to move back up. From Waves perspective, prices are either moving in an impulse fashion or it is in (a-b-c) pattern, in both the scenarios the bias is positive. The internal structures indicate that prices are moving in wave v of iii/c in which it is extended. As far as 150 is intact on the downside wave v of wave iii/c is set to soar near t...