Posts

USDINR: NEO Wave Extracting Triangle in making?

Image
 USDINR spot daily chart As shown in the above daily chart, USDINR is been moving in a sideways direction mainly in the range of 77-73 levels in past two years. Currently prices are hovering near to the resistance of the upper range as mentioned above, there is high possibility that prices will dip from here to test the lower range. At present there is no change in trend, as the pair continue to move in a rising channel. However, there is a Neo Wave pattern in making which is a possible reversal pattern.  After completing wave W at 72.25, prices moved higher in a complex correction pattern (w-x-y). In wave y there is a high possibility where Neo Wave Extracting Triangle is in making, which will complete wave X and then wave Y will eventually turn prices down towards 73-73.5 levels minimum, it can go down further as well. The summation is USDINR is all set to reverse and possibly hit the level of 73-73.5 levels over short term, only if it does not go above the 76.5 levels (spot...

MCX Crude Oil and Elliott/ Neo Wave Analysis

Image
 MCX Crude Oil daily continuous chart As shown in the above daily chart, prices are moving in higher highs and higher lows and it is precisely moving in a rising channel. Currently prices have arrived near to the resistance of the channel and it seems that upside is not capped. I have used Neo Wave Analysis to understand the possibility for Crude Oil prices I firmly think prices after hitting in negative terrain has moved up in an impulse structure and the first wave is undoubtedly is extended. To support this wave 2 need not go below 38.2%, here in this case it is above 23.6% of wave 1. Wave 3 which is either ongoing or over, is well below 61.8% from wave 1 to wave 2, currently at 50%, it can go up or might be over. In this case wave 4 will be simpler and easy to identify. Basically should not enter in the terrain of wave 2 which is at 6500 levels (as per Neo Wave rule). Wave 5 will be way shorter than wave 3 and will eventually fuse out close to 7800-8000 levels. The summation is...

MCX Gold and Elliott Wave Analysis

Image
 MCX Gold Daily chart From the above chart, prices are moving in a higher highs and higher lows and it is precisely moving in a rising channel. Gold which is a safe haven has seen a stupendous rally on the back of Russia - Ukraine crisis, which soared the yellow metal above 3% on a single day. On the other day the rally was knackered and as a result it closed below the low of the previous day.  As per wave theory, prices which earlier I thought is moving in a triangle pattern has now unfolded in a regular flat pattern where wave b has gone well above 61.8% of wave a. I think wave c lower has started and there is a high possibility for the c wave to reach till 45000-44000 levels over short to medium term. To embellish wave c has the possibility to fail. The summation is MCX God is all set to plunge till 45000-44000 over short to medium term.

Nifty: Elliott Wave Analysis Anticipated Happened

Image
 Nifty 60 mins anticipated on 7th Feb 2022 Nifty 60 mins chart happened on 24th Feb 2022 In my previous update on Nifty, I had mentioned that, "  Nifty is all set to plunge to test 16400-16000 levels over short to medium term." Nifty faltered as per my view and made a low of 16200 which was in the range mentioned by me - Anticipated Happened To check my previous article on Nifty, click on the below link https://www.marketanalysiswithmeghmody.com/2022/02/nifty-elliott-wave-analysis.html The benchmark has arrived near crucial support and can bounce back, this can eventually turn into complex correction and so wave x can move higher from here till the resistance of the falling channel or can start a fresh leg higher, crossing all the hindrances. The summation is Nifty is set to soar from here near till 17600-17800 levels over short to medium term.

USDINR: Anticipated Happened

Image
 USDINR 60 mins spot chart anticipated on 23 Feb 2022 USDINR 60 mins spot chart happened on 24 Feb 2022 In my previous article on USDINR, I had mentioned that, " The summation is USDINR is all set to soar till 75.7 over short to medium term." Prices made a high of 75.69 today thereby achieving my mentioned level - Anticipated Happened You can see my previous article on USDINR, for that just click on the below link https://www.marketanalysiswithmeghmody.com/2022/02/usdinr-elliott-wave-analysis.html I was expecting wave c higher despite of showing two probabilities, Now as wave c might have completed, chances are high that prices will change the trend by moving sideways and later continue the major trend.  I will continue to monitor this uptrend and will update as and when there is a major reversal. My targets in this currency pair is done.

USDINR: Elliott Wave Analysis

Image
 USDINR 60 mins spot chart The currency pair is moving in a very different Elliott Wave pattern and I have been scratching my head to find out the probability of the next wave to unfold. However, in my previous articles of USDINR I thought it will cross its previous ATH but after looking the current pattern, I think it will NOT. In USDINR I have come up with 2 scenarios 1st Scenario: Prices are moving in a complex correction where it has ended wave a at 75.3 followed by wave b in a w-x-y pattern at 74.32 and now it awaits for wave c to go higher. 2nd Scenario: The pair has completed wave a at 75.75 followed by wave b at 74.32 and wave c higher 75.70 over short term. The summation is USDINR is all set to soar till 75.7 over short to medium term.

GBPINR: Third Correction Starts

Image
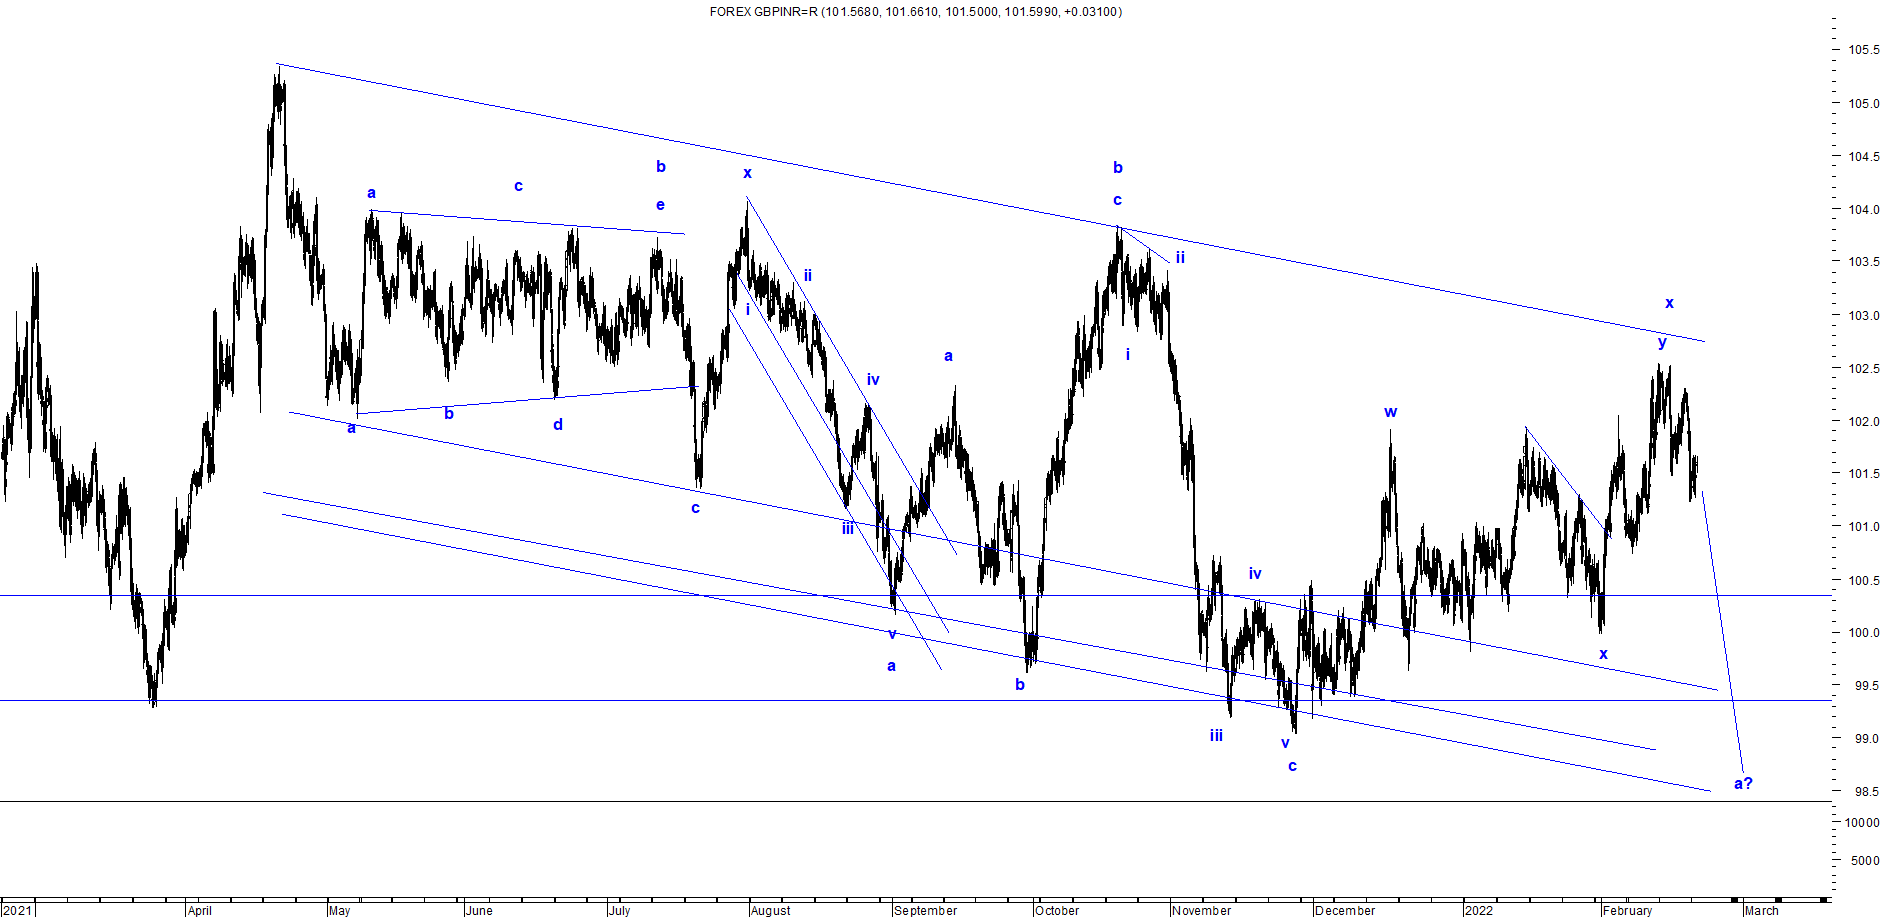
 GBPINR 60 mins spot chart GBPINR is moving in lower highs and lower lows and it is precisely moving in a falling channel, this opens negative possibilities. Prices have arrived near to the resistance of the channel and there are high chances for it to reverse from current levels. As per wave theory, prices are moving in a triple correction as discussed earlier, where it completed wave x for the second time and now it has opened wave a of the third correction which can falter till 99.5-99 levels (spot) To see my previous article on GBPINR click on the below link GBPINR: Triple Correction? https://www.marketanalysiswithmeghmody.com/2022/01/gbpinr-triple-correction.html GBPINR: Anticipated Happened https://www.marketanalysiswithmeghmody.com/2022/02/gbpinr-anticipated-happened.html The summation is GBPINR is all set to plunge till 99.5-99 levels over short to medium term.