Posts

Nasdaq Elliott Wave Analysis

Image
 Nasdaq 2 hour chart Analysis As seen in the above chart, prices are moving in a sideways to positive trend. However, the benchmark has arrived near to the resistance of the red horizontal trend line, giving an indication that prices will resist in the zone of 12280-12400 levels. Prices are also forming rising wedge pattern which is a pattern of distribution and can move sideways to positive for some time. Eventually, prices will then crack and can move down towards the support lower horizontal red trend line. From Waves perspective, the benchmark is moving in a corrective wave (a-b-c) where it completed wave a and wave b and currently it is moving higher in the form of wave c where it has completed wave iii of wave c and can falter towards 12100-12000 price range in the form of wave iv of wave c. The summation is Nasdaq can tumble towards 12100-12000 levels in near term and then can move higher till 12400 levels. The benchmark will then crack and move down till 11000 levels over m...

Comex Gold

Image
 Comex Gold 4 hour chart Analysis As seen in the above chart, prices are moving in an expanding wedge pattern and in my previous update I had mentioned that gold prices are expected to move down towards $1980 levels which can be utilised as a buying opportunity. To view my previous update on Comex Gold, click on the below link https://www.marketanalysiswithmeghmody.com/2023/05/comex-gold-anticipated-happened-and.html Prices are moving down as expected but has not breached $2000 levels. As the lower trend line is rising, the buy zone now appears to be in $1980-1990 levels. RSI is also moving towards oversold terrain. From Waves perspective, prices are moving in wave v of wave v which is forming expanding diagonal pattern (i-ii-iii-iv-v) where wave iv is under making where it can falter towards $1990-1980 levels and then wave v of wave v on the higher side which can move towards $2100-$2110. The summation is Comex Gold can be bought near to the level of $1990-$1980 levels for the up ...

GBPUSD Ending Diagonal and breakout

Image
 GBPUSD daily chart Analysis In the above daily chart, it is very clear that there is no discontinuation of the positive trend, as prices are moving in a higher highs and higher lows. Recently the pair made a distribution pattern which is rising wedge pattern. This pattern is a time consuming pattern and has completed as prices have given a bearish break. RSI in the daily chart has exhibited negative divergence which gives an indication that the upside is very limited or capped. From Wave theory, prices were moving in a impulse fashion (1-2-3-4-5) where in wave 5 it formed an ending diagonal pattern where wave v of wave 5 was an overthrow and it re-entered the pattern which marks the end of wave v of wave 5 and also of wave 5. Now prices will unfold a corrective move which has already started in the form of wave a on the lower side which can tumble near till 1.20 followed by 1.18 over medium term. GBPINR needs to break 102.00 levels to open negative possibilities and that will also...

Nifty Bank Elliott Wave Analysis

Image
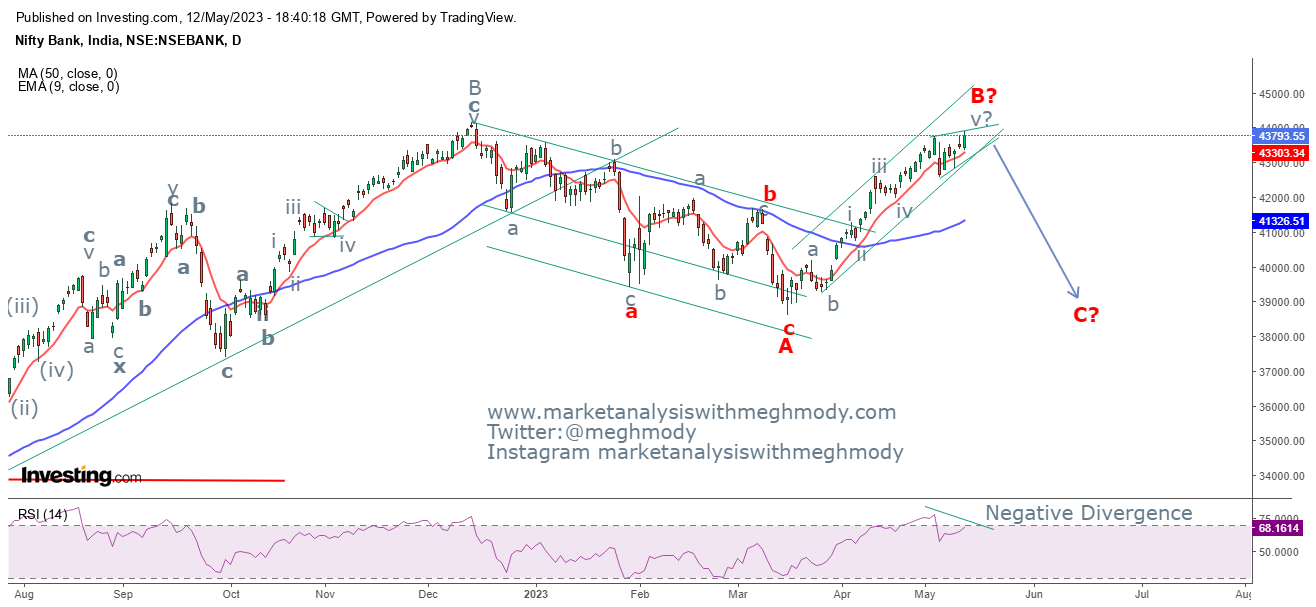
 Nifty Bank daily chart Nifty Bank 2 hour chart Analysis From the above daily chart, Nifty Bank continues to move higher and has also crossed its previous high which opens positive possibilities. However, RSI has arrived in the overbought terrain and can make the index move in a limited range going ahead. The oscillator is also exhibiting negative divergence which is a sign of caution. The index continues to trade well above both the moving averages which gives an indication that it is very difficult for the index to show any reversal yet, but there can be profit booking which can drag prices near to its previous swing low. As seen in the 2 hour chart, the benchmark has arrived near to its previous high and has started showing negative divergence which is not a healthy sign. Along with that, it is likely that it might remain in the range of 4400-43500 levels in coming week as there is a good open interest built up near 43500 which will now act as a support for the index. As per Wav...

Nifty Elliott Wave Analysis

Image
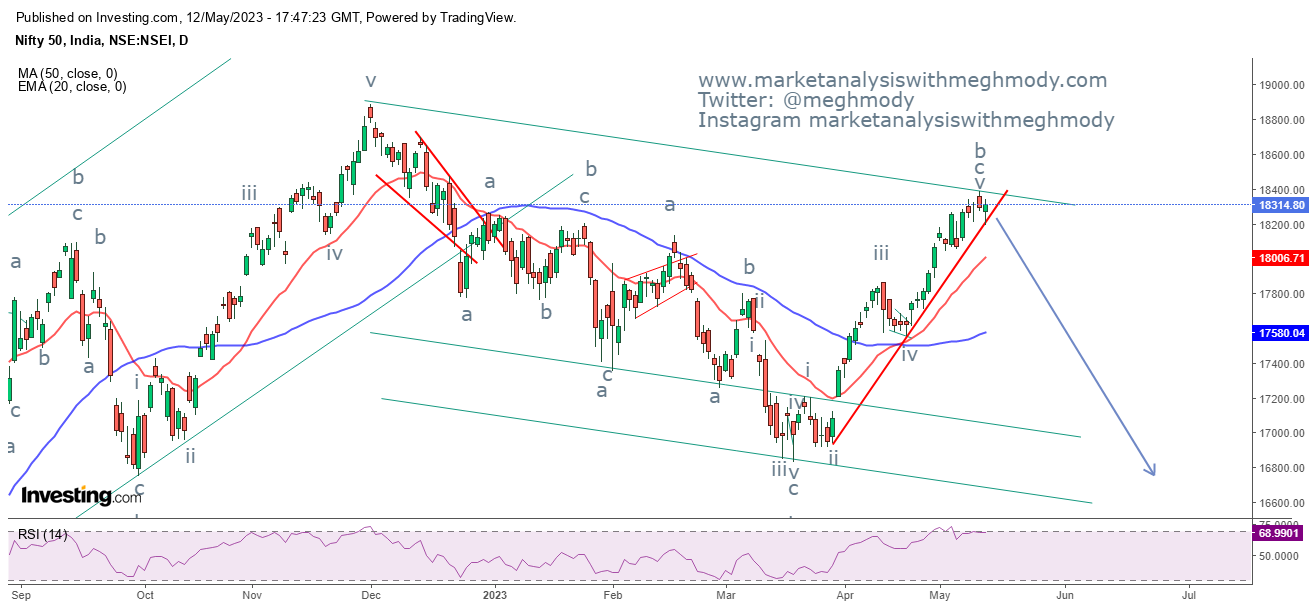
 Nifty daily chart Nifty 2 hour chart Nifty Open Interest 18th May 2023 Analysis In my previous update I had clearly mentioned that Nifty will change the trend from positive to negative once the level of 17970-17950 zone is broken on the downside. However, the index continues to move higher with the trend and made a new high instead.  As seen in the above daily chart, prices are currently moving in a higher highs and higher lows by precisely taking support of the rising red trend line. As far as the index is above the red trend line the bias remains positive. It is only the break of the trend line which will open negative possibilities and possibly resume the downtrend. To support the view it is very clear that RSI is in overbought terrain and it has made an attempt to relieve from the zone thereby exhibiting negative divergence. From 2 hour chart, prices are currently consolidating and it seems that next week it is expected to be in a tight range of 18300-18200 levels where m...

Nifty Bank: Dark Cloud Cover

Image
 Nifty Bank daily chart Nifty Bank 2 hour chart Analysis Nifty Bank has formed a dark cloud cover in weekly chart, bearish candle stick pattern. The index has closed below the 20 EMA moving average (red) in the daily chart, thereby opening negative possibilities. Also the index was down by 1000 points on Friday which was steep and has also broken its previous support which is a negative sign. RSI which was in overbought terrain is now moving out but still way above the center line. From 2 hour chart, prices have closed below both the short term moving averages which is a bearish sign as this indicates a possible reversal to happen. If the downfall continues then there is a high chance for the index to reach and break 42000 levels. As per Elliott Wave, the index has probably completed wave b of wave c lower and has opened wave c of wave c which can move towards 38000. As of now Nifty Bank can break below 42000 followed by 41600 levels over short to medium term. The summation is Nift...

Finnifty: Elliott Wave Analysis

Image
 Finnifty daily chart Finnifty 2 hour chart Analysis From the above chart, the index has found a multiple resistances and has shown signs of reversal by forming dark cloud cover in the weekly chart. This is a bearish reversal pattern and needs a follow up action next week which will decide the future road for the index.  Also in the daily chart, it is very clear that the index has closed below its previous swing low thereby discontinuing the higher highs and higher lows formation. There is a high possibility for the index to break the level of 18650 levels over short term. In 120 mins chart, prices have shown text book sign of reversal. If you see up close, the move on Thursday (up), the index took 12 hours to reach 19496 levels from 19171 levels. This low was taken out in less than 12 hours indicating strong reversal. RSI is also exhibiting negative divergence which is a sign of caution. Elliott Wave Analysis suggests, prices have completed five up move and also wave c of wav...